VTI vs VOO: Comparing Vanguard’s Two Largest ETFs
This article compares VTI vs VOO — Vanguard’s Total Stock Market ETF and Vanguard’s S&P 500 ETF — Vanguard’s two largest ETFs.
Both are passively managed index ETFs popular with passive investors looking for near-market returns.
Index ETFs track market indexes, such as the Dow Jones Industrial Average or the Russell 2000.
VTI is a wider-scoped ETF that tracks the total U.S. stock market as indexed by the CRSP US Total Market Index. It includes small-cap, mid-cap, and large-cap stocks.
VOO tracks the most widely-watched U.S. stock market index: Standard & Poor’s 500 (S&P 500). The S&P 500 contains just over 500 large-cap stocks.
Both funds are market-cap-weighted, meaning the percentage of each holding aligns with the relative size of the companies in the indexes. The largest companies comprise the largest percentage of the funds, and the smallest comprise the smallest.
Table of Contents
Bottom Line Upfront (BLUF)
Before I get into the details of VTI vs VOO, it’s essential to keep the following in mind:
- Both ETFs are excellent, low-fee options for your portfolio. They are Vanguard’s largest ETFs by net assets.
- VTI is a total U.S. market fund and holds more than 3,500 stocks. VTI is better diversified and benefits from small and mid-cap stocks that grow into large caps.
- VOO is less diversified, tracking the performance of the S&P 500 Index. VOO excludes small and mid-cap stocks.
- Being market-cap-weighted ETFs makes these funds quite similar, as the top 500 stocks in VTI make up a high percentage of the fund (see overlap).
- VOO maintains a slight 10-year performance edge as of mid 2024 (see performance), but returns are similar due to the market-cap weighting.
- Both ETFs are available to purchase from any online broker.
- If you have an account with Vanguard or Fidelity, you can own similar mutual funds (see mutual funds).
Please note that both ETFs update their prospectuses regularly. The information referenced in this article will change over time.
The best resource for both funds is the respective company’s websites.
Here are links to the most updated resources at Vanguard. Consider the information in the following links to be the authoritative data source.
- Vanguard Total Stock Market ETF (VTI)
- Vanguard’s S&P 500 Index ETF (VOO)
VTI vs VOO Comparison
Side-by-Side
Here’s a side-by-side comparison of both ETFs. Scroll right on mobile.
A few noticeable differences comparing VTI vs VOO:
- VTI is more diversified with 7X the number of holdings as VOO, but those additional holdings have low weightings.
- The top ten stocks make up a higher percentage of the fund for VOO. VTI is close.
- The VTI and VOO dividend yields are similar.
- The expense ratios are identical.
- VTI is older, but VOO is a larger ETF.
- VOO’s performance edges VTI’s over a 10-year investment horizon. Past performance is not indicative of future results.
Holdings Overlap
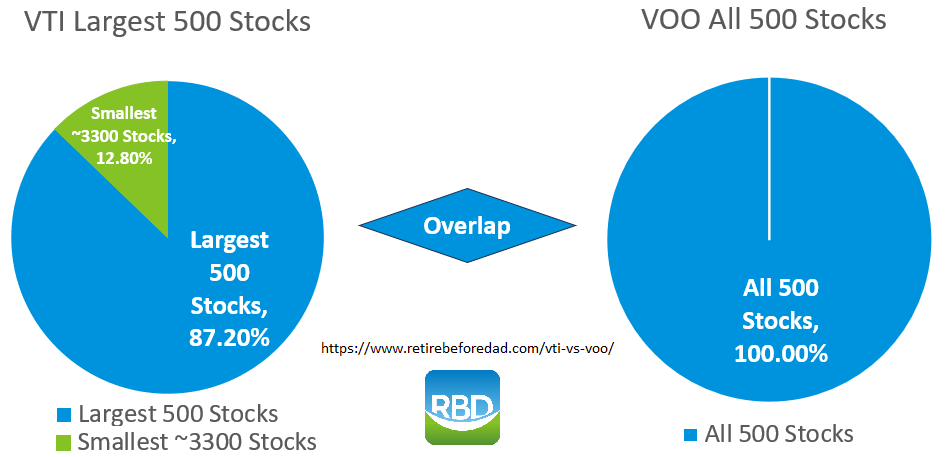
As market-cap-weighted ETFs, the top 500 stocks in VTI make up a high percentage of the fund. VOO is also market-cap-weighted but only has 500 stocks.
Therefore, there is a significant overlap between the funds.
The top 500 stocks in VTI make up approximately 87% of the ETF’s weighted holdings. The balance of stocks, about 3,300 small and mid-cap stocks, make up the remaining 13% of the ETF’s weighted holdings.
Benchmark Indexes
VTI tracks the CRSP US Total Market Index.
CRSP stands for Center for Research in Securities Prices, an affiliate of the University of Chicago.
Visit this page for the latest information about the index.
The index is comprised of more than 3,800 constituents across “mega, mid, small, and micro capitalizations”.
The index represents 100% of the U.S. investable equity market.
VOO tracks the S&P 500 Index, one of the most widely-watched stock indexes worldwide.
Visit this page for the latest information about the index.
The S&P 500 Index is a float-adjusted market cap-weighted index, meaning the largest stocks make up a proportionately high percentage of the index. Lower market cap stocks make up a proportionately lower percentage of the index.
A selection committee of financial market professionals chooses which stocks go into the index. The focus is primarily on large-cap stocks that are representative of the U.S. economy.
The committee does not try to “pick stocks” for market outperformance. Instead, they look at company size, stock liquidity, share float, and profitability, and it fits the index’s goal to reflect the broad, large-cap marketplace accurately.
Performance Chart
Here is a daily updated chart of a $10,000 investment performance in both VTI vs VOO over ten years. Scroll right on mobile.
This chart shows each stock’s net asset value (NAV) price performance. It does not include dividends, which are subtracted from the NAV when a dividend is paid.
Past performance is not indicative of future results.
Though VOO has outperformed VTI over the past ten years, the difference is not significant enough to influence a portfolio. Either fund is a suitable income-producing asset in your portfolio.
See the table above for up-to-date three-, five-, and ten-year average annual performance records.
Dividend Payout Schedules
Both VTI and VOO pay quarterly dividends.
Investors receive quarterly dividend payments in March, June, September, and December.
Mutual Fund and ETF Equivalents
Here are the closest mutual fund equivalents for both ETFs.
- VTI = VTSAX (identical)
- VOO = VFIAX (identical)
The VTI mutual fund equivalent is VTSAX, the Vanguard Total Stock Market Index Fund Admiral Shares. Investors with an account at Vanguard who prefer mutual funds can consider VTSAX as a VTI alternative.
The VTI Fidelity equivalent is FSKAX, Fidelity Total Market Index Fund. Fidelity does not have an ETF equivalent. Only buy Fidelity mutual funds through a Fidelity account to avoid unnecessary fees.
The VOO mutual fund equivalent is Vanguard’s S&P 500 Index Fund Admiral Shares (VFIAX).
The VOO Fidelity equivalent is FXAIX, the Fidelity ® 500 Index Fund. Fidelity does not have an ETF equivalent.
The State Street SPDR VOO equivalent is the SPDR S&P 500 ETF Trust (SPY).
Customers of online brokers that charge fees for mutual funds should use the VTI or VOO ETFs.
Mutual funds trade differently than ETFs, which trade like stocks.
ETFs are easier to own, and the price changes throughout the day. Mutual funds only trade at the market close.
Active investors typically use ETFs for trading purposes or to buy and hold indexes when they can’t access index mutual funds.
For example, if you have an investing account with a discount investing app, you’d invest via ETFs instead of mutual funds.
If your account is with Vanguard, you may prefer to use the index funds VTSAX or VFIAX because it’s slightly easier to reinvest capital gains and dividends.
- Learn more about VTSAX here
- Learn more about VFIAX here
Use the above resources to find the most up-to-date information regarding VTSAX and VFIAX.
Best Broker to Buy VTI or VOO
Vanguard and Fidelity are excellent choices for long-term retirement investors. You’re in good hands if your IRA or employer-sponsored plan is with either broker.
Here are my other favorite online brokers for investing in ETFs and automatically reinvesting dividends.
Conclusion
Deciding between VTI vs VOO comes down to exposure to all U.S. stocks vs the 500 largest.
The VTI ETF includes all U.S. large-cap, mid-cap, and small-cap stocks (about 3,800 stocks in total)
The VOO ETF includes only U.S. large-cap stocks (about 504 stocks in total).
VTI holds all the stocks that VOO has, but VOO does not hold all the stocks VTI has.
VTI vs VOO overlap is significant — 87% as of this article. That means the funds are about 87% identical. The other 13% in VTI is allocated toward small and mid-cap stocks VOO doesn’t hold.
VOO has outperformed VTI over the past 10 years, but only slightly as of writing. However, VOO has a greater concentration of risk exposure in the top 10 holdings and funds altogether. But the risk is minimal since the S&P 500 is a broad index already.
If the stock market declines significantly, both ETFs will decline in tandem. The divergence between large-cap and small-cap returns is the main scenario that would cause dissimilar returns.
VTI has nearly seven times as many holdings as VTI. However, because it is a market cap-weighted fund, a large portion is allocated to giant tech companies such as Apple and Microsoft.
Investors who want to own the entire U.S. stock market with one fund should choose VTI.
Investors who want to track only the largest U.S. stocks in the S&P 500 should choose VOO. VOO investors can also supplement their portfolio with small and mid-cap ETFs
Own VTI or VOO in retirement accounts to save on dividend taxation.
Purchase either ETF at any commission-free online broker.
Please reply with your questions regarding VTI vs VOO in the comments section below. Include any requests you have about adding more detail to this article.
Additional Resources
Disclosure: The author is long VTI and multiple stocks in the top 10 holdings of each fund. I’ve chosen the VTI ETF for myself for broad exposure through one fund, but please evaluate both funds in the context of your personal investment objectives before choosing which is right for you.

Craig is a former IT professional who left his 19-year career to be a full-time finance writer. A DIY investor since 1995, he started Retire Before Dad in 2013 as a creative outlet to share his investment portfolios. Craig studied Finance at Michigan State University and lives in Northern Virginia with his wife and three children. Read more.
Favorite tools and investment services (Sponsored):
Boldin — Spreadsheets are insufficient. Build financial confidence. (review)
ProjectionLab — Build financial plans you love. (review)
Empower — Free net worth and portfolio tracking + retirement planning. User since 2015.
Sure Dividend — Research dividend stocks with free downloads (review):
- Dividend Kings — 50+ stocks that have increased dividends for 50+ years.
- Monthly Dividend Stocks — List of 70+ stocks that pay a dividend every month.
- Dividend Champions — 140+ stocks that have increased dividends for 25+ years.