Portfolio
 This portfolio page shows the current holdings in our family’s retirement, taxable brokerage, alternative assets, and college savings accounts.
I also share our forward 12-month forward investment income (F12MII) and a chart showing our progress toward financial independence.
I’ve maintained this page in one format or another since 2013.
I’m not a perfect investor or financial expert. Please don’t consider this page to be advice or a template to copy.
My goal is to provide a transparent picture of how we invest while using mostly percentages to keep some privacy. I share what I’m comfortable with and withhold what I’m not.
That said, there are a lot of moving parts, and I’m not always optimized or on top of things. Just a guy on the internet sharing his portfolio as of the publish date.
Data is current as of February 28th, 2023.
Bold links go to our partner websites and may result in paid leads or commissions.
Table of Contents
Stocks and Bonds (Retirement and Taxable Accounts)
We have eight different accounts with Fidelity between my spouse and me. They include two traditional IRAs, two Roth IRAs, two employer-sponsored retirement accounts (a 403(b) and 401(a) with my former employer), a SEP IRA, and a taxable brokerage account.
I also have a taxable brokerage account with M1 Finance.
To create the charts on this page, I extract all the account data and consolidate it into an elaborate spreadsheet designed to make it easy to update this page.
The charts that come out of this process help me understand our total assets and shape annual rebalancing.
Our retirement accounts hold several Fidelity index funds that satisfy my target asset classes with the broadest coverage (highest number of holdings). We own a few managed mutual funds from our old 401(k)s that have performed well, so we’ve kept them.
I also own a portfolio of dividend growth stocks and some speculative growth stocks. These are long-term holdings that I’ve slowly accumulated over more than 25 years.
In recent years, I’ve spent less time conducting stock research and relying on paid stock newsletter services such as:
- Sure Dividend Newsletter (review)
- Motley Fool Stock Advisor(review)
- Motley Fool Rule Breakers (review)
As I progress from a full-time employee to self-employed to a fully retired traveler, I’ll slowly move away from owning individual stocks in favor of index funds and specialty ETFs. This is to diversify and reduce the burden of stock research (which I don’t enjoy as much as I used to). I’ll always own some individual stocks, but likely fewer as I age.
I also expect to gravitate toward a lower-risk portfolio closer to a 60/40 stock-to-bond ratio.
Below is a consolidated look at the total assets in our nine brokerage accounts (mobile users, scroll right).
We own a few different “total market” index funds because of limitations in my employer accounts. I left my company but will continue to utilize the 403(b) until I’m sure I will never return.
There is no access to a total market all-inclusive fund (e.g., FSKAX) in my employer accounts, so I use FXAIX, FSMDX, and FSSNX to achieve a similar broad market exposure to FSKAX.
Because of this oversight by my employer plan, we own more index funds than I would like (many employees have complained).
| Symbol | Description | % |
|---|---|---|
| VARIOUS | DIVIDEND STOCK PORTFOLIO | 28.30% |
| FSKAX | FIDELITY TOTAL MARKET INDEX FUND | 19.37% |
| VARIOUS | GROWTH STOCK PORTFOLIO | 9.91% |
| FSGGX | FIDELITY GLOBAL EX US INDEX FUND | 6.18% |
| FSSNX | FIDELITY SMALL CAP INDEX FUND | 5.83% |
| FSMDX | FIDELITY MID CAP INDEX FUND | 5.48% |
| FXNAX | FIDELITY US BOND INDEX FUND | 4.91% |
| FXAIX | FID 500 INDEX | 3.40% |
| FTIHX | FID TOTAL INTL IDX | 3.04% |
| FCNTX | FIDELITY CONTRAFUND | 2.94% |
| ETFs | VTEB, SCHD, VNQ, MUB, HYMB, PFF | 2.09% |
| FSRNX | FIDELITY REAL ESTATE INDEX FUND | 2.05% |
| FNMIX | FIDELITY NEW MARKETS INCOME | 1.40% |
| CASH | CASH | 1.29% |
| FOCPX | FIDELITY OTC PORT | 1.21% |
| VTSAX | VANGUARD TOTAL STOCK MARKET INDEX ADMIRAL | 1.20% |
| FPADX | FIDELITY EMERGING MARKETS INDEX FUND | 0.76% |
| VTABX | VANGUARD TOTAL INTERNTL BD INDX ADM | 0.64% |
| 100.00% |
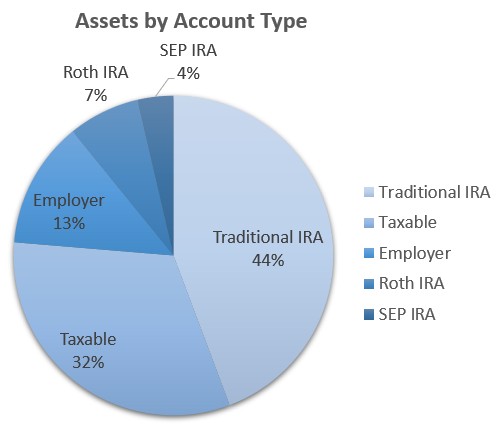
Here’s the same group of assets broken out by account type. Many of our stocks and funds are held among multiple accounts.
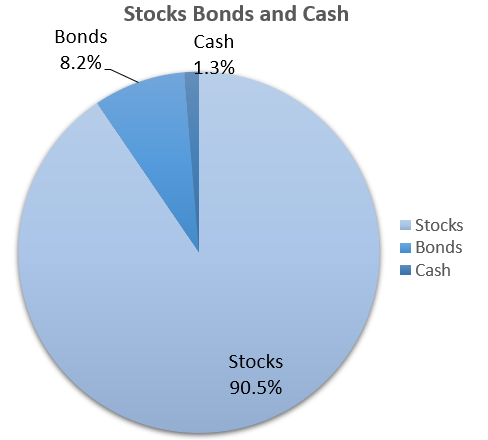
The next chart is the current ratio of stocks to bonds and cash.
To estimate an appropriate stock-to-bond portfolio ratio — subtract your age from 120 to get a ballpark target percentage for stocks.
120 minus your age = % stocks in your portfolio
Use 130 if your risk tolerance is high and 110 if your risk tolerance is low.
For example, I’m 47, and my risk tolerance is high. So my stock-to-bond ratio is about 83/17. According to the latest chart, I have a bit of rebalancing to do!
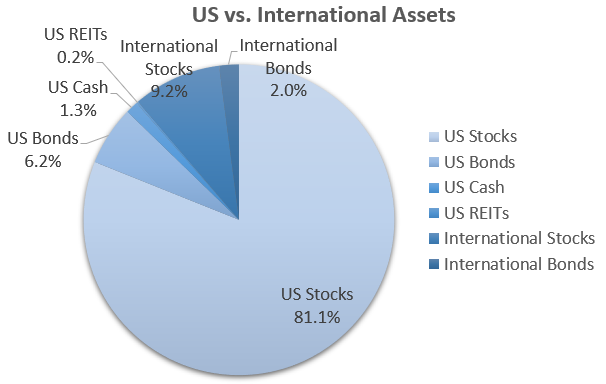
Here’s a look at our U.S. investments vs. international.
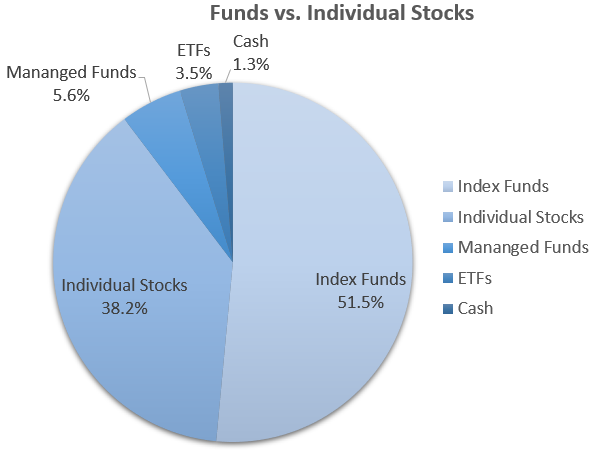
The next chart is a deeper dive into our portfolio, looking at index funds vs. individual stocks vs. managed funds and ETFs.
Index funds and ETFs are a larger portion of the pie since my last update, and I expect that trend to continue as I own fewer individual stocks and more diversified ETFs.
Alternative Investments
Wealthy people typically own alternative assets. The general definition of alternative assets is anything other than stocks and bonds.
Access to alternative assets has exploded in the last decade. Some examples of alternative assets now available to retail investors include:
-
- High-quality commercial real estate
- Farmland
- Private credit
I have invested in commercial real estate through various real estate crowdfunding platforms over the years, and it’s been one of my best-performing investments.
I’ve also started to dabble in venture capital funds — only recently available to non-accredited investors.
The next frontier is farmland. I hope to make my first investment in 2023 through a self-directed IRA.
Crowdfunded Real Estate
I’m currently active on two real estate crowdfunding platforms.
- Fundrise (review) — Best for beginners. Own diversified real estate portfolios starting at a $10 minimum investment. Non-accredited investors are welcome.
- Arrived Homes (review) — Own shares of single-family and vacation homes. $100 minimum investment. All U.S.-based investors are eligible. Follow along as I share my personal Arrived Homes returns.
- EquityMultiple (review) — Access to individual commercial properties for higher risk/reward and low-risk high-yield alternatives to savings accounts.
In the past, I also tried RealtyShares and PeerStreet which both shut their doors.
Here’s a breakdown of my assets in both Fundrise and EquityMultiple. The latest Fundrise total was roughly $26,000. EquityMultiple is about $30,000. Visit the respective reviews for more information on each.
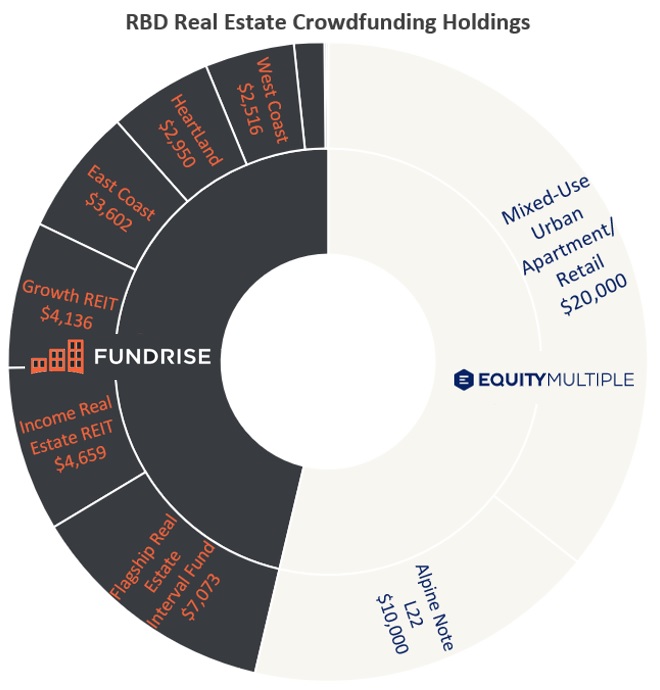
The primary difference between the two platforms is Fundrise allows almost anyone to invest and easily diversify among dozens of properties.
EquityMultiple is for more serious real estate investors willing to risk more to earn more.
The mixed-use EquityMultiple property that I own a piece of is a somewhat speculative investment. But I know the location where it is and believe it’s an opportunity to earn better long-term returns than the stock market if I’m patient.
Alpine Notes are short-term alternatives to cash. I’m earning 6.5% in that fund for six months. These are good investments to earn higher yields than savings accounts.
Please note: This is a testimonial in partnership with Fundrise. We earn a commission from partner links on RetireBeforeDad.com. All opinions are my own.
Venture Capital Funds
New in 2022, two companies launched platforms to empower non-accredited retail investors to own pre-IPO startups. These funds hold late-stage startups — high-quality companies that are in the IPO pipeline.
I own both due to my interest in IPOs.
Venture capital investing is typically reserved for institutions and wealthy investors. Individual investors can invest directly in pre-IPO companies through multiple pre-IPO platforms that give liquidity to employees of private startups.
But direct investments are for accredited investors only (invested assets > $1 million, or income above $200,000 single/$300,000 married).
The two platforms now available to non-accredited investors are:
- Fundrise Venture
- The ARK Venture Fund
These are higher-risk investments, so only invest with money you can afford to lose. The fact that they are funds of multiple investments helps to reduce risk.
You’ll need to open accounts with either platform to invest. These are not publicly traded.
Fundrise Venture
Yes, the same Fundrise that revolutionized real estate investing with its crowdfunding model now has a venture capital fund.
Fundrise Venture is a unique opportunity to own pre-IPO companies and benefit from growth before the IPO. The fund only holds one investment to date, but we expect this number to grow in 2023.
Fundrise also used cash in the fund to support startups impacted by the SVB crisis in March 2023.
The minimum to invest is $10. I invested $2,000 to initiate a position.
Please note: This is a testimonial in partnership with Fundrise. We earn a commission from partner links on RetireBeforeDad.com. All opinions are my own.
ARK Venture Fund SoFi Invest
SoFi Invest is a fintech company and online broker that offers alternative investments.
Cathie Wood leads ARK Invest and the ARK Venture Fund. ARK Invest has a few ETFs that invest in innovative public companies. She’s a CNBC regular and known for crushing the market from 2019 to 2020.
However, her ETFs cannot own pre-IPO companies, so Wood has reached into her network to get access to private companies. The fund invests in both public and private companies, but the private ones make this opportunity unique.
The fund has a $500 minimum to invest. I invested $1,000 to initiate a position.
Some of the early pre-IPO investments include:
- Flexport
- Discord
- Epic Games (Fortnite creator)
Read my comprehensive ARK Venture Fund review on my other website if you want to learn more.
Taxable Dividend Stock Portfolio
My dividend stock portfolio is the primary account I’ve blogged about since the inception of RBD. Though I’m no longer reporting all of the specific transactions every quarter, I continue to share the income it produces.
Eighty percent of this portfolio resides in a taxable account at Fidelity. When the cash balance reached $1,500-$2,000, I would make a new investment to increase shares in an existing holding or initiate a new stock position.
But since leaving my career, I am living off the dividends until I am earning more from my business. I withdraw funds on the 16th of each month to fund our expenses.
The remaining 20% of this portfolio is in a taxable account at M1 Finance. M1 Finance is great because you create your portfolio first, then add funds to make it grow — as opposed to traditional brokers, where you buy holdings one at a time.
Read my M1 Finance review to understand how pie investing works.
This portfolio started in 1995 with my first stock. From there, I built the portfolio by selecting dividend stocks using various lists and valuation metrics.
Specific resources I use include the Sure Dividend Newsletter and the Dividend Aristocrats list.
For guidance on where to have accounts for dividend investing, see my guide Best Online Brokers for Dividend Reinvestment.
Here’s a history of my dividend portfolio’s income going back to 2015. I’ve organized the data by income by month per year.
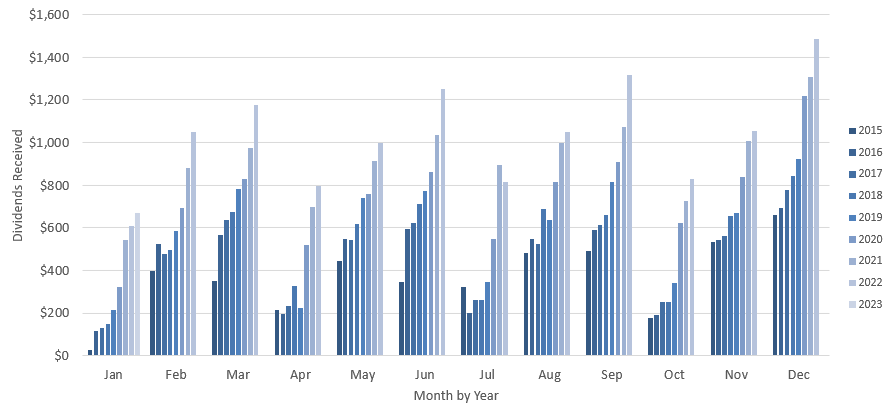
The next chart is the total annual dividends I’ve earned since 2015. These two charts only include dividends received in taxable brokerage accounts (non-retirement).
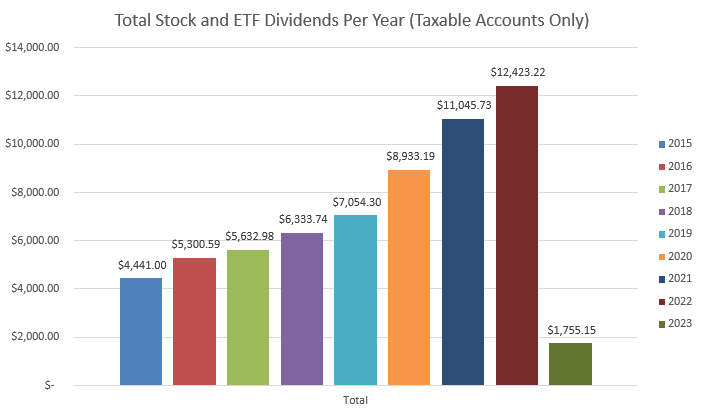
This chart has a nice upward slope. But since I’m not working a full-time job and living off the dividends, I expect 2023 to be flat or only slightly higher due to dividend increases.
College Savings
The first of my three children will start college in 2031. We’ve been saving since each was born, but at the rate we’re saving ($4,000 per kid per year), I still don’t expect it to be enough.
I’ll encourage our kids to attend an in-state school, which averages about $25,000 per year before room and board.
Whatever I don’t save in college accounts, I plan to pay for with current income cash flow, which I plan to earn from my side business.
To save, we participate in the Virginia Invest529 program. Click that link to read my long-maintained navigation guide.
This plan lets us choose index funds for our investment options. I prefer index funds over target-date/age-based funds.
As of early 2023, we have about $150,000 saved in the Virginia Invest529 plan. All of it is in Vanguard stock index funds. I’ll start shifting to owning more bonds in the next few years.
We may also use tax-free withdrawals of our I Bonds to pay for college.
Forward 12-Month Investment Income (F12MII, aka Forward Passive Income)
I’ve been calculating my forward 12-month investment income number to measure my passive income investments since 2003. Other bloggers call this the “projected annual dividend income” (PADI), which is probably better 🙂
But I include more than just dividends.
The F12MII number is what I expect to earn from passive income streams in the following 12 months.
| Other Forward Income Streams | Yearly Income | Average Monthly Income |
|---|---|---|
| Dividends | 13032.32 | 1086.03 |
| Cash Savings + I Bonds | 3957.67 | 329.81 |
| RE Crowdfunding | 1775.22 | 147.94 |
| Total Forward Annual Income | 18765.21 | 1563.77 |
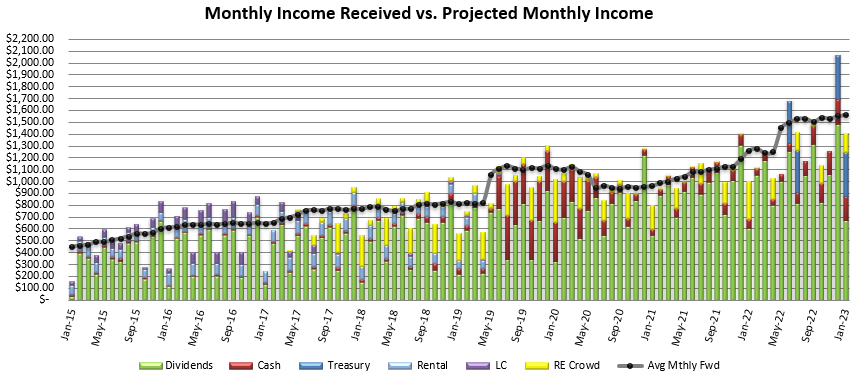
And here’s the more familiar income received vs. project chart I’ve been updating and sharing since January 2015. The black and grey line is projected F12MII. Each bar is what I actually received in each month.
Over the years, the mix of assets has changed, especially after selling my condo in 2019 and buying I Bonds in 2021 and 2022. Earnings on cash savings has increased due to Treasury yields.
The dividend income has always been steady and growing.
Financial Independence Number
Read more about the financial independence number here.
I measure progress toward financial independence by tracking our annual expenditures and subtracting F12MII.
I multiply that number by 25 to give me a target financial independence number. When our invested assets (excluding home equity and college 529 savings) surpassed our financial independence number in February, we reached financial independence.
I also calculate our FI number against net worth.
Of course, financial independence isn’t a straight shot. 2021 was great for stocks, so we went way past our number, only to revert in 2022. We’ve hovered around our FI number for the past year or more.
I left my job, but since I’m still earning money and Mrs. RBD is working, we are not “retired” yet. Therefore, we’re not safely withdrawing our assets.
We are living off dividends until our income is sufficient enough to be investing again.
Reaching financial independence was an important milestone, but we’re not stopping our pursuit of more wealth and financial security for years to come.
Here’s the chart:
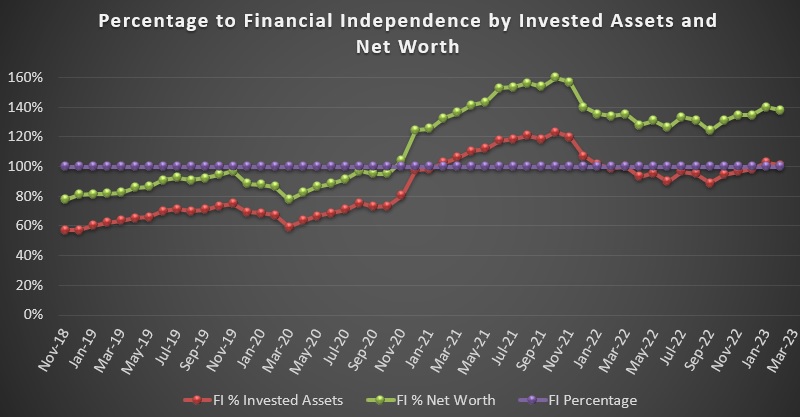
Photo by lutfi nur fauzi via Unsplash

Craig is a former IT professional who left his 19-year career to be a full-time finance writer. A DIY investor since 1995, he started Retire Before Dad in 2013 as a creative outlet to share his investment portfolios. Craig studied Finance at Michigan State University and lives in Northern Virginia with his wife and three children. Read more.
Favorite tools and investment services (Sponsored):
Boldin — Spreadsheets are insufficient. Build financial confidence. (review)
ProjectionLab — Build financial plans you love. (review)
Empower — Free net worth and portfolio tracking + retirement planning. User since 2015.
Sure Dividend — Research dividend stocks with free downloads (review):
- Dividend Kings — 50+ stocks that have increased dividends for 50+ years.
- Monthly Dividend Stocks — List of 70+ stocks that pay a dividend every month.
- Dividend Champions — 140+ stocks that have increased dividends for 25+ years.