Here’s How I Track Spending in Excel Using Pivot Tables
 I use a simple Excel spreadsheet with pivot tables to track spending. I’ll explain why I started this exercise this year and why I felt the free online tools were inadequate for my purposes.
Tracking spending this way is a compliment to tracking net worth and my taxable investment portfolio. With an accurate annual spending number and investment portfolio values, I’m able to measure progress toward financial independence (FI).
Today’s article will only cover how I track spending. Early next year, I’ll follow this post up with the details on how I calculate my financial independence number… a retirement savings milestone.
You can download the free spreadsheet I use for all the screenshots in this post at the bottom. Jump to the spreadsheet.
Table of Contents
Why I Started Tracking Spending in Excel
Pursuing any goal requires measurement. While writing about reaching financial independence before early retirement (aka F.I.B.E.R) in 2017, I realized I didn’t know how much our family spends in a calendar year.
For single people with a few accounts, tracking spending is simple. But as your family grows and the types of transactions and accounts grow, it gets more complicated.
For years, I used Mint.com for budgeting purposes. But I grew tired of the tool because it required so much work to get everything categorized correctly.
Empower is awesome for tracking net worth and investments. But its budget functionality also takes an effort to categorize spending.
Detailed categorization is more than I need. All I want is a single annual spending number to determine my financial independence number.
To get your FI number, simply multiply your annual spending by 25.
For example, if you spend $60,000 per year, your FI number is $1,500,000. This is based on the 4% safe withdrawal rate rule of thumb (explained here).
This is the most basic way to determine if you are financially independent. I’m using more of a hybrid approach by subtracting my forward 12-month investment income (F12MII) from annual spending, then applying the 4% rule of thumb to my retirement savings accounts.
More details on that process in the follow-up post.
But without that annual spending number, I couldn’t determine my FI number at all.
Why I Chose Excel
I’ve used Excel spreadsheet wizardry to track my entire financial life since I graduated college. A financial modeling course during my junior year of college hooked me on Excel.
Not long ago, I showed you how I meticulously track dividend income in Excel.
I also manually log every banking transaction in a spreadsheet. Doing this keeps my checking and savings accounts balanced every day.
This may seem like overkill, but that’s what I do. And it doesn’t take up too much of my time. Logging every transaction enables me to manage excess cash flow with precision.
Since I’m already logging every dollar in and out of our primary joint checking account, I knew I could extract the spending information I needed.
All that was required was a new transaction category column. From there, I can use the pivot table function in Excel to automatically calculate total spending per month and per year.
Google Sheets also has pivot table functionality.
A reader commented on Facebook to say that Mac Numbers does not support pivot tables, but there is a workaround tutorial on YouTube.
Pivot Tables Explained
Pivot tables are a built-in spreadsheet functionality. They look at large data source tables and enable you to organize the data for your specific purposes.
Beginners may be a bit intimidated by the tool. But once you get the hang of it, they’re not too advanced but offer significant power and flexibility to the user.
Up until about a year ago, I was never that comfortable with pivot tables. But now that I use them for career purposes, I’ve found them to be extremely useful.
The best way to show you how they work is to demonstrate how I’m using them to track spending. I’ll use dummy data to illustrate what I’m doing with my own data.
Most banks allow you to download transaction history to a CSV file. This can be opened with Excel. Then all you have to do is apply a category to each transaction. This can also be automated with simple rules.
How to Track Spending Using Excel Pivot Tables (Step-by-Step)
This process came naturally to me since I already had my checking account data in a spreadsheet. But it’s quite simple to download the data to get started. Then you’ll need to categorize each transaction (some banks and credit cards allow you to do this in the account), then create the pivot table.
Step 1: Download CSV File of Checking Transactions
I use Wells Fargo for my checking accounts. We have a joint account, a separate account for our rental property, and a business account for my blogging side business.
Most, if not all, banks allow you to download transaction history. It may not be in a perfectly usable format, but it’s better than manually typing each transaction. You can either download to a CSV file or to Quicken.
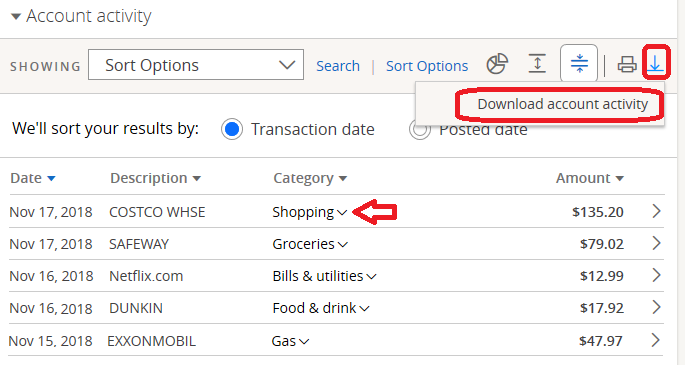
If you use Quicken or similar software, you probably already know your annual spending. Here’s what it looks like on the Wells Fargo website:

Choose the date range you want (January 1st to today), then select Comma Delimited, CSV, or spreadsheet.
That will get your transactions into a spreadsheet.
Step 2: Download CSV File of Credit Card Statement
If you want to get more granular with your expense tracking, you can also download your spending history from your credit card statement.
Our family uses the Chase Sapphire Preferred credit card for all of our monthly spending. It keeps our spending organized in one place and earns us awesome travel rewards.
We redeem our points for free travel — the card helped us fly our family of five to see my in-laws in California!
The Chase account website has built categorization that works well on its own. But once you download the spreadsheet, you can get as detailed as you want by adding your own categories (see Step 4).
Here’s how to download your transactions:
Step 3: Validate your Column Headers
Once you have your spreadsheets and the transactions from both your bank and credit cards, validate that your have the column headers you need and they are clearly distinguishable. You’ll need them to create pivot tables later on.
Create a column at the end called Category if your downloaded spreadsheet doesn’t already have it.

Step 4: Create Categories
Create whatever categories you want. If you like to get granular with your categories (groceries, eating out, dog sitting etc), you can build those into your spreadsheet or use a tool like Mint or Empower. They both provide hundreds of standard categories plus customization.
That was too detailed for me. I just want to distinguish between what’s an expense and what isn’t so that I know my annual spending number.
Here are the categories I use for transactions:
- Deposit
- Dividend
- Expense
- Interest
- Investment
- Misc
- Transfer
Now, for every transaction, add a category. Make this work for your own purposes. I’m mostly interested in the expenses. I consider utility bills, our mortgage, credit card bills, ATM withdrawals, and preschool tuition all expenses.
Investment transfers and transfers between checking and savings are what made Mint frustrating to me. I do a lot of automated transfers and I felt I was always telling Mint to ignore them.
Here’s an example of added categories:

Step 5: Create a Pivot Table
OK, now we have everything we need to create our pivot table. I’m going to show you three months of dummy data first so you see what the pivot table is made of. Then I’ll step through the pivot table to get the results. This may get long.
Source data table (you can copy this data set and paste to Excel yourself, or download the spreadsheet below).
| Date | Withdrawal | Deposit | Description | Category |
|---|---|---|---|---|
| 10/1/2018 | $2,400.00 | Paycheck | Deposit | |
| 10/1/2018 | $(1,400.00) | Mortgage | Expense | |
| 10/2/2018 | $(500.00) | Preschool Tuition | Expense | |
| 10/5/2018 | $(120.00) | Electricity Bill | Expense | |
| 10/15/2018 | $2,400.00 | Paycheck | Deposit | |
| 10/16/2018 | $(100.00) | Water Bill | Expense | |
| 10/20/2018 | $(65.00) | Internet | Expense | |
| 10/22/2018 | $(15.00) | Overdraft Fee | Misc | |
| 10/25/2018 | $(600.00) | College 529 Investments | Investment | |
| 10/26/2018 | $(500.00) | M1 Finance | Investment | |
| 10/29/2018 | $(1,000.00) | Credit Card Bill | Expense | |
| 10/30/2018 | $(100.00) | ATM Cash | Expense | |
| 10/31/2018 | $(400.00) | Transfer to Savings | Transfer | |
| 11/1/2018 | $2,400.00 | Paycheck | Deposit | |
| 11/1/2018 | $(1,400.00) | Mortgage | Expense | |
| 11/2/2018 | $(500.00) | Preschool Tuition | Expense | |
| 11/5/2018 | $(135.00) | Electricity Bill | Expense | |
| 11/15/2018 | $2,400.00 | Paycheck | Deposit | |
| 11/16/2018 | $(80.00) | Water Bill | Expense | |
| 11/17/2018 | $13.00 | Refund | Misc | |
| 11/20/2018 | $(65.00) | Internet | Expense | |
| 11/25/2018 | $(600.00) | College 529 Investments | Investment | |
| 11/26/2018 | $(100.00) | M1 Finance | Investment | |
| 11/27/2018 | $(100.00) | ATM Cash | Expense | |
| 11/29/2018 | $(1,200.00) | Credit Card Bill | Expense | |
| 11/30/2018 | $(633.00) | Transfer to Savings | Transfer | |
| 12/1/2018 | $2,400.00 | Paycheck | Deposit | |
| 12/1/2018 | $(1,400.00) | Mortgage | Expense | |
| 12/2/2018 | $(500.00) | Preschool Tuition | Expense | |
| 12/5/2018 | $(80.00) | Electricity Bill | Expense | |
| 12/15/2018 | $2,400.00 | Paycheck | Deposit | |
| 12/16/2018 | $(80.00) | Water Bill | Expense | |
| 12/20/2018 | $(65.00) | Internet | Expense | |
| 12/21/2018 | $(200.00) | ATM Cash | Expense | |
| 12/25/2018 | $(600.00) | College 529 Investments | Investment | |
| 12/26/2018 | $(100.00) | TD Ameritrade | Investment | |
| 12/29/2018 | $(1,200.00) | Credit Card Bill | Expense | |
| 12/31/2018 | $(575.00) | Transfer to Savings | Transfer |
So let’s now create the pivot table.
First, we highlight the data range. The table above starts at cell A1 and goes to cell E39. Simply use your mouse to highlight that range.
With the range highlighted, select Insert/Pivot Table.

This will bring you to a popup screen that says Create PivotTable. Our range is already selected for us since we highlighted it.

Then select either New Worksheet or Existing Worksheet. This a personal preference. I’m putting mine in F3, right next to my checking account transaction table.
Two new views will show up in the sheet. A placeholder for where the pivot table will go, and a Pivot Table field area.


This next part is where it can get a little tricky. From the PivotTable Fields box area, drag the column headers into one of the four quadrants.
In this case, I want to know the totals for each category. Therefore, the Category column header will go to the Rows box. Withdrawals and Deposits will go in the Σ Values box. The Columns box will self-populate.
Here’s what it looks like:

As you drop the column header names into the boxes, the table starting at F3 will transform from the placeholder to the data we’re looking for.
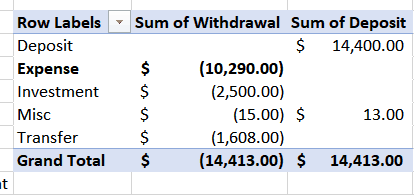
You can see, the total of all expenses for the three months in the source data table is $10,290.00. That’s the number I’m looking for.
When I do this same thing for the entire year, I get my total annual expenses. Total annual expenses multiplied by 25 is your baseline financial independence number.
But I’m going to take this a few steps further. We can also add a count to both the Withdrawals and Deposits. Do this by dragging the column header to the box. Then use the drop-down arrows in the Σ Values box and choose Count instead of Sum.
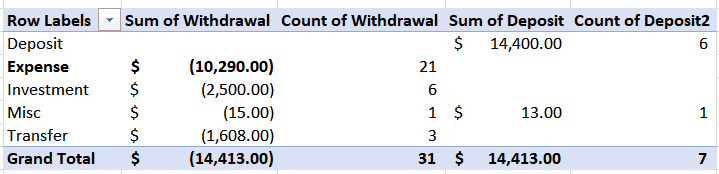
Now we also know that 21 of the 38 transactions were expenses.
Step 6: Spending by Month
I wanted to break my own spending down further by month. Since we already have a data set, it’s just a matter of creating a new pivot table.
Highlight the data range again, and select Insert/PivotTable again.
This time, I drag Category to the Row box again, then also add Date underneath it. Excel automatically anticipates that I’m looking for months and auto-populates it. Then I unselect Date so I only have Month.
Now I’m only going to look at Withdrawals, so I drag that to the Σ Values box.
That gives us the view below. I’ll use the filter drop down for the next step.

Next, since I’m only interested in the expenses, I use the filter drop down and select Expense.

Now I have my total expenses and my expenses per month.
In my own spreadsheets, I created one last table summing the values for the transaction description. This gives me a further breakdown of spending without any more work.
Download the Spreadsheet
Download the free spreadsheet here.
Conclusion
Without accurate annual spending numbers, it’s not possible to calculate your financial independence number. Estimating isn’t going to cut it if you’re serious about early retirement.
For me, calculating my annual spending with free tools was a challenge because our financial lives are fairly complicated. We have a lot of accounts, transfers, two credit cards, and dozens of transactions per month. The default categories were always wrong and it took to much time to straighten things out when all I care about is total spending.
So I set up my own simplified method to get me the number I need without much additional effort. It allows me to distinguish between transfers, investments, and expenses, giving me more accurate data.
This may not help you at all if you’re a power-budgeter or all-in with software or an automated tool. However, at the very least, if you aren’t familiar with pivot tables, it may be worth your while to try out the spreadsheet I’ve provided in this post to see how they might be useful for your own spreadsheets.
In a follow-up post, I’ll take the annual spending number and show you how I calculate my financial independence number. It’s far less complicated and doesn’t require pivot tables.
What tools do you use to track spending? Does Mint, YNAB, EveryDollar, or Empower work for you or are you similarly frustrated with automated tools?
Featured photo via DepositPhotos used under license.

Craig is a former IT professional who left his 19-year career to be a full-time finance writer. A DIY investor since 1995, he started Retire Before Dad in 2013 as a creative outlet to share his investment portfolios. Craig studied Finance at Michigan State University and lives in Northern Virginia with his wife and three children. Read more.
Favorite tools and investment services (Sponsored):
Boldin — Spreadsheets are insufficient. Build financial confidence. (review)
ProjectionLab — Build financial plans you love. (review)
Empower — Free net worth and portfolio tracking + retirement planning. User since 2015.
Sure Dividend — Research dividend stocks with free downloads (review):
- Dividend Kings — 50+ stocks that have increased dividends for 50+ years.
- Monthly Dividend Stocks — List of 70+ stocks that pay a dividend every month.
- Dividend Champions — 140+ stocks that have increased dividends for 25+ years.