Basic Technical Analysis for Dividend Investors
Does technical stock analysis deserve a place in a dividend investor’s tool belt? Yes, I think it does for adding insight to short-to-mid-term trends and pricing. But technical analysis should only play a secondary and supplemental role after exhaustive fundamental and qualitative analysis.
Some dividend investors may steer clear of technical analysis entirely because it isn’t a good indicator of a solid long-term investment. Others may argue that long-term investors shouldn’t worry about short-term prices.
Unless you are exclusively dollar cost averaging, at some point, you have to pull the trigger and buy shares, and it’s better to use a limit order than a market order.
With limits, you need to set a price. For me, that’s where basic technical analysis comes into play. And if technical analysis can help to get a better price, who doesn’t want that?
Utilizing technical data can help you set entry prices for buying stocks and confirm stock price trends. For investment nerds like myself, technical analysis is also interesting and fun.
The subject of today’s article is Simple Moving Averages.
For DRIPs and dollar cost averaging, I only use technical analysis when I initiate a new position. Otherwise there’s no need to since I am buying at regular intervals. I mostly use technicals to determine an entry price for stocks I buy in my taxable TD Ameritrade account and occasionally for index ETFs in my retirement accounts.
While technical analysis is helpful for some investors, it’s certainly no magic bullet. It’s another tool in our tool belts. Technical analysis is not an exact science by any means. For dividend investors, it’s a more thorough way to analyze a stock price when you are ready to make a purchase.
Some Wall Street analysts make a full-time job of technical analysis, and think the market is all one big math problem. That is ridiculous to me. Basing a buy or sell decision solely on technical analysis is not a good strategy for long-term income investors. Leave that to the traders.
Technical indicators can easily be added to regular charts and are shown in relation to the stock price. Consider them visual supplements to a basic stock chart, based on historic data. After I go over how I use the simple moving average, I’ll show you how to add technical indicators to your charts on Yahoo Finance.
Simple Moving Averages (SMA)
A moving average (MA*) , or simple moving average, is the average closing price of a stock for the past X number of days. This is a lagging indicator meaning it confirms a long-term trend is happening after the trend is in motion. A representation of this line is easily added to a basic chart.
The most common moving averages for stocks are the 50-day and 200-day. They indicate longer term trends in the stock price and neutralize volatility, or smooth out the curve. These two lines are generally used as “support” or “resistance” for a stock price.
If the stock is trading above its 50-day MA, the 50-day line is becomes a level the stock should stay above in an upward trend. So if the stock hits its 50-day MA on the way down, that could be a good place to set a limit order. If the price dips below its 50-day MA, that is considered a bearish sign and a break in the trend if a rebound doesn’t shortly follow.
Conversely, if the stock is trading below the 50-day MA, the 50-day becomes resistance to the upside.
The 200-day MA works the same way only the line is less volatile and is considered stronger support and resistance.
When the two moving averages cross each other, that is considered a crossover and suggests a change in trend has already occurred.
Check out this one-year chart of YUM! Brands (YUM) below. The stock price has fluctuated over the past year. But the 50 and 200-day MAs are mostly headed upward. Notice the 50-day is a bumpier ride than the 200-day. In this case, the first two times the stock broke through the 50-day (red) and 200-day (green) MAs, it was a buying opportunity. The stock went higher shortly after. This is not uncommon in a bull market.

Recently at $70/share, perhaps it is a buying opportunity again. Companies with consistent earnings growth tend to maintain the upward trend, but eventually micro and macro conditions will cause the stock price to challenge the moving averages.
Now that the price is below both the 50 and 200-day MAs, those lines become resistance to the upside. Meaning, $74.84 (see green label in above chart) is the first level of resistance to the upside, and $78.28 (see red label in above chart) is the level above that.
Notice this chart says nothing about the tainted-meat scandal that YUM is dealing with in China. Relying solely on technical analysis is foolish.
From here, one of three things will likely occur. The first is that the price will recover back above its moving averages like it did it October and February of the past year. If that occurs the trend lines will continue headed north again and downside support will be reestablished.
The second scenario is that the price of the stock remains stable below the moving averages for the next quarter. The 50-day would move lower and 200-day would slowly follow. Should the 50-day MA cross below the 200-day, that would be considered a bearish indicator and could mark a further downturn or a stagnant low price for a while. Eventually, the 50-day and 200-day will continue lower, hit a bottom, and reverse. When the 50-day MA eventually crosses back over the 200-day MA to the upside, that would signal a bullish event and active money managers may start buying again.
Thirdly, the stock continues downward and the moving averages keep following the stock price down. If the company is performing poorly, it may keep going down. That is where qualitative and quantitative analysis becomes more important.
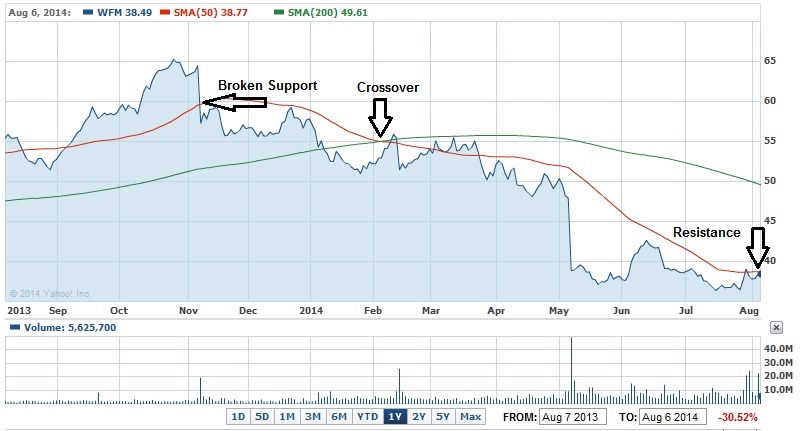
Below is another one-year chart, this time for Whole Foods Market (WFM), a stock I bought in a retirement account before it was purchased by Amazon. Here you can see a good example of when a crossover was a bearish signal and the stock followed with a nose dive. In November we saw a break in the 50-day MA. Combined with fundamental analysis, active investors may have spotted the beginning of something. In February, we see the 50-day crossover the 200-day, another bearish signal. Indeed, what followed was a bearish downturn.
The 50-day and 200-day MAs followed downward further after the big sell-off in May. After such a sell-off, it can be a good time to buy, if further research indicates the business is still strong. While the stock has traded lower for the past few months, the MAs have continue downward and the 50-day is now beginning to rebuild a base and reverse. As of last week, the price is hovering below the 50-day MA which now represents upside resistance around $39.
I bought after the big drop in early May. The stock has continued to be in a good range to accumulate more shares since then. With long-term prospects in check, eventually, the price will break the 50-day to the upside, then 200-day, and continue upward again. At that point, the 50-day and 200-day MAs will reverse upwards, following the stock price and become downside support again.
Entry Price for Limit Orders
Choosing an entry price on moving averages alone is not a good strategy. Buying when the price is just above the 50 or 200 is one place you can set a limit. But the price can always break below that level, and that strategy doesn’t work if the price is already below the MAs.
Fundamental and further technical analysis should be exercised to determine a price the investor is comfortable with. For me, I use more fundamental analysis to give me a range of where I want to buy a stock. Obviously I want to buy at the low end of the range. Technical analysis can help determine that bottom range in the short-term, over the course of a few days.
Caveat
Math and statistical analysis of stocks is only one way to look at things. With all the programmatic, high frequency and quant trading happening out there, relevant technical levels are often places where you’ll find more volume. For example, if you are looking at a stock trading at $41, and the 50-day MA is $40, on a down market day you may see the price get to $40 or slightly below and see volume increase from the automated traders or institutional traders.
The great irony of technical trading is that while it’s based on math and statistics, trading on technicals is psychological. A trader decides to buy or sell (or programs a computer to buy or sell) when a certain technical levels are reached. It makes them feel good because there’s data and a chart to back up the price they are choosing. Technicals have nothing to do with earnings or the health of a company. So you have all these individual and institutional investors trading with each other based on what the charts say, which in the grand, long-term scheme of things, is meaningless to the performance of the company. In other words, take technicals with a grain of salt and don’t skim on the fundamentals.
How to Add Moving Averages to Your Charts
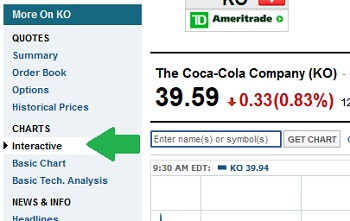
I prefer Yahoo Finance for all of my charting when using my desktop. On my mobile device I use my TD Ameritrade iPhone app. From Yahoo Finance, adding technical indicators is very easy. First get a quote of the company you are analyzing. I’m using everyone’s favorite sugar-water company for this example.
Then click on Interactive on the left hand side (you can also use Basic Tech. Analysis).
Chose a time frame. I prefer 6-month or a one-year charts for moving averages. Next click the Technical Indicators drop down menu and select Simple Moving Average (SMA).
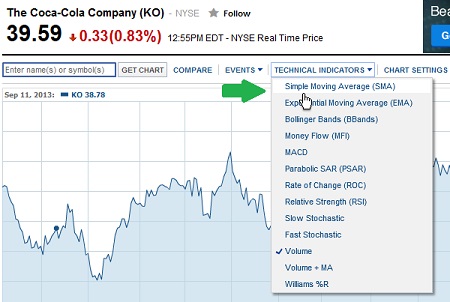
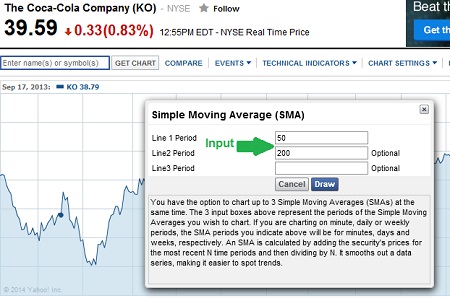
After that, input the SMA periods and click Draw. I chose 50 and 200 to make it simple for this example. 10, 20, and 100 day moving averages are also commonly used.
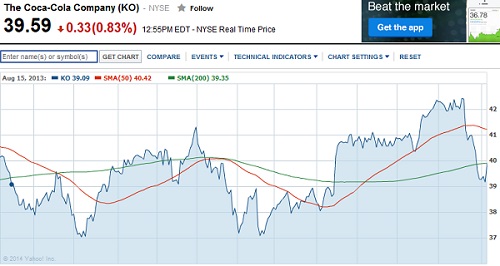
Voila! Your lines are drawn.
I hope you found this exercise useful. Technical analysis is yet another skill to learn for dividend investors, but mostly for when you are ready to make a purchase in your brokerage account, or to spot a short-term trend. In the coming related posts, I’ll be covering a few other indicators and overlays such as the Bollinger Bands, stochastics, and the relative strength index (RSI).
Do you use technical analysis when you buy stocks? Or is this all a bunch of Wall Street gibberish?

Craig is a former IT professional who left his 19-year career to be a full-time finance writer. A DIY investor since 1995, he started Retire Before Dad in 2013 as a creative outlet to share his investment portfolios. Craig studied Finance at Michigan State University and lives in Northern Virginia with his wife and three children. Read more.
Favorite tools and investment services (Sponsored):
Boldin — Spreadsheets are insufficient. Build financial confidence. (review)
ProjectionLab — Build financial plans you love. (review)
Empower — Free net worth and portfolio tracking + retirement planning. User since 2015.
Sure Dividend — Research dividend stocks with free downloads (review):
- Dividend Kings — 50+ stocks that have increased dividends for 50+ years.
- Monthly Dividend Stocks — List of 70+ stocks that pay a dividend every month.
- Dividend Champions — 140+ stocks that have increased dividends for 25+ years.