When to Sell Stocks and Buy Bonds
Risk-free government Treasury yields have risen dramatically over the past year.
The increase was a direct result of the Federal Reserve rate increases that started in 2022.
Higher short-term yields are good for retirees and give us multiple options to earn risk-free returns on idle cash while maintaining liquidity.
But the fast pace of the Fed Funds interest rate increases has had unintended consequences, as we saw last week with the failure of Silicon Valley Bank.
We’ve become so accustomed to lousy government bond rates over the past decade that the latest yield curve has income investors kind of excited — even though inflation is still higher.
Here’s a look at today’s yield curve compared to a year ago.
Investors believe higher rates are a short-term phenomenon to deal with inflation, thereby inverting the yield curve.
That’s when short-term rates are higher than long-term rates — especially when the 2-year rate is higher than the 10-year rate.
An inverted yield curve is indicative of a potential forthcoming recession.
But the 2-10 gap has narrowed in the past week due to the anticipation the Federal Reserve may pause or slow the pace of future rate increases due to the regional banking volatility.
A “normal” yield curve is indicative of a healthy growing economy. It slopes from bottom left to right, as the red line depicts.
Short-term Treasury yields now beat most high-yield savings accounts and dividend ETFs, making them an attractive income investment.
Owning Treasurys can be as easy as setting up a core position “sweep” with your brokerage account, where any idle cash is swept into an interest-bearing account.
Investors can also buy individual bonds or term-specific bond funds or ETFs to gain exposure and receive the yield.
Some investors may even question if the time is right to sell stocks to buy government bonds in light of the higher rate environment and market volatility.
For long-term investors, the answer is no.
As a general rule, stocks outperform bonds — by a lot. This is especially true as the investment horizon becomes longer.
So trying to time the market by exiting stocks and going into government bonds is a bad idea.
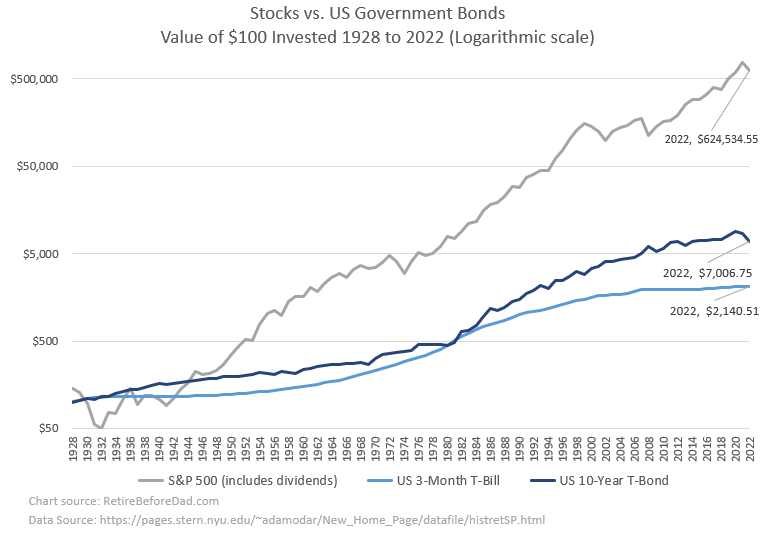
Here’s a chart showing the long-term returns of stocks vs. short and longer-term bonds since the start of 1928:
 Data Source Link: stern.nyu.edu
Between 1928 and the end of 2022, stocks outperformed the 10-year Treasury bond by 89 times.
A $100 investment in the S&P 500 at the start of 1928 would have been worth $624,534.55 by the end of 2022, including dividends.
The same $100 investment over the same period in 10-year T-Bonds would be worth $7,006.75, and short-term 3-month T-Bills would be worth $2,140.51.
So for most of us with a long-term outlook (five+ years), it only makes sense to sell stocks to buy bonds when adjusting your portfolio’s stock-to-bond ratio or during annual portfolio rebalancing (more on stock-to-bond ratio at the end *).
Peter Lynch highlights one exception to the stocks-outperform-bonds rule in his 1993 book, Beating the Street.
When to Sell Stocks and Buy Bonds (According to Peter Lynch)
Peter Lynch is the legendary mutual fund manager who ran Fidelity’s Magellan fund from 1977 through 1990. The fund averaged a 29.2% annual return during his tenure, beating the S&P 500 by more than double.
His books were among the first I read while getting started investing in the mid-1990s.
Lynch received his undergraduate degree from Boston College, where a close friend of mine was studying finance and recommended his books One Up on Wall Street and Beating the Street.
I remembered a passage in one of the books about when to sell stocks and buy bonds and tracked down a copy to refresh my memory.
Lynch spends most of Beating the Street encouraging investors to own stocks instead of bonds.
He used a similar stock vs. bonds comparison as the chart above. His comparison was from the 1920s through about 1990.
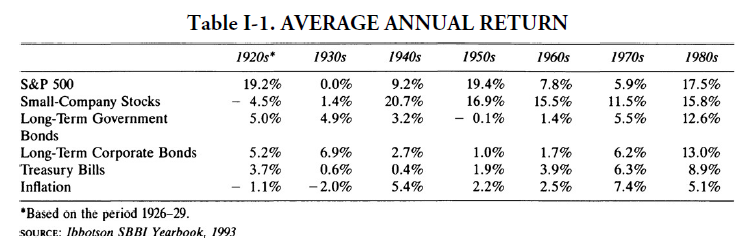 Source: Beating the Street
Peter’s Principle #2:
Over the entire 64 years covered in the table, a $100,000 investment in long-term government bonds would now be worth $1.6 million, whereas the same amount invested in the S&P 500 would be worth $25.5 million. Gentlemen who prefer bonds don’t know what they’re missing.
He is consistent with his preference for stocks over bonds, with one exception.
Peter’s Principle #8 — the only exception to the general rule that owning stocks is better than owning bonds:
When yields on long-term government bonds exceed the dividend yield of the S&P 500 by 6 percent or more, sell your stocks and buy bonds.
He adds context:
Interest rates had gone so high that my biggest position in the fund for several months running was long-term Treasury bonds. Uncle Sam was paying 13–14 percent on these. I didn’t buy bonds for defensive purposes because I was afraid of stocks, as many investors do. I bought them because the yields exceeded the returns one could normally expect to get from stocks.
Interest rates in the early 1980s soared as Paul Volker raised the Fed Funds rate to quash inflation. Though the economy suffered in the short term, Volker is considered a hero for making the difficult decision to trigger a recession to end the 1970s-era inflation for good.
Lynch assumed the super-high rates wouldn’t last long and bought long-term U.S. bonds. It’s unclear if he held to maturity or not.
The 1980s were an anomaly over the past 80 years. Rates peaked in 1980-1981. Then, from the early 1980s until 2022, government bond rates trended downward.
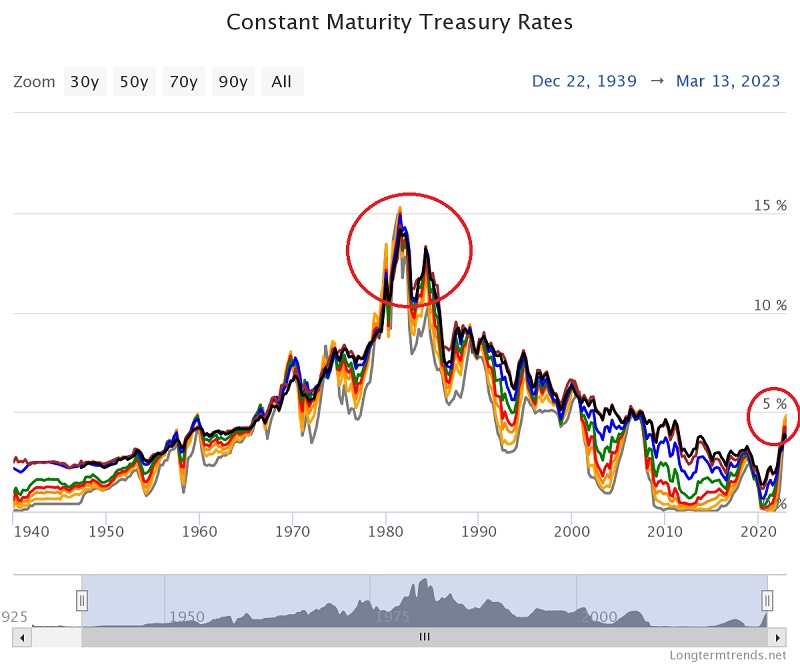 Source: LongtermTrends.net
Seeing today’s rates compared to the past 80 years, we appear to be in the early stages of reversing the 40-year downward trend. But we’re still far from a point where it makes sense to sell stocks to buy bonds.
The S&P 500 yield is just below 2%, and the 10-year T-Bond yields 3.7%.
So according to Peter’s Principle #8, we’re still 4.3 percentage points away from when we’d even begin to consider selling stocks to buy bonds.
His principle makes sense because if long-term stock market returns average 9% a year with significant market risk, wouldn’t you accept an 8% risk-free return?
But even then, we’re not mutual fund managers. Such high rates may be an opportunity to put new investment dollars into long-term risk-free bonds, but I’d be hesitant to sell stocks for that purpose considering multiple factors such as capital gain taxes, abandoning winners, and overthinking.
Here’s the yield curve from August 21st, 1981, compared to today:
We’re nowhere near 1980s inflation or interest rate levels, yet higher rates are throwing banks for a loop. That’s because everyone’s become accustomed to low rates.
Once inflation starts to normalize closer to 2%, the Federal Reserve can ease rates again. But at this stage, we don’t know how far they will need to raise rates to quell inflation or if going higher will cause other naked swimmers to be exposed.
Will rates go as high as the 1980s? Let’s hope not.
And when rates do come down again, who knows how far?
Hold onto that pre-2022 mortgage.
* Determine Your Stock-to-Bond Portfolio Ratio
Here’s a rule of thumb to determine your stock-to-bond portfolio ratio.
120 minus your age = % stocks in your portfolio.
If you have a higher risk tolerance, use 130. Lower, use 110.
For example, I’m 47, and my risk tolerance is high. So my stock-to-bond ratio is about 83/17.
Determine your stock-to-bond ratio and stick to it regardless of interest rates or market activity.

Craig is a former IT professional who left his 19-year career to be a full-time finance writer. A DIY investor since 1995, he started Retire Before Dad in 2013 as a creative outlet to share his investment portfolios. Craig studied Finance at Michigan State University and lives in Northern Virginia with his wife and three children. Read more.
Favorite tools and investment services (Sponsored):
Boldin — Spreadsheets are insufficient. Build financial confidence. (review)
ProjectionLab — Build financial plans you love. (review)
Empower — Free net worth and portfolio tracking + retirement planning. User since 2015.
Sure Dividend — Research dividend stocks with free downloads (review):
- Dividend Kings — 50+ stocks that have increased dividends for 50+ years.
- Monthly Dividend Stocks — List of 70+ stocks that pay a dividend every month.
- Dividend Champions — 140+ stocks that have increased dividends for 25+ years.