Future Value and the Magic of Compound Interest
 The future value (FV) formula is a Finance 101 and retirement planning staple that allows us to estimate what current assets will be worth at a future date.
It’s one of the baseline formulas that let us build more complex personal financial models using elaborate spreadsheets or more sophisticated tools like Boldin and ProjectionLab.
Future value is a pen-and-paper math equation but more easily calculated with an Excel or Google Sheets function.
Here’s the basic example we’ll use throughout this post to illustrate future value:
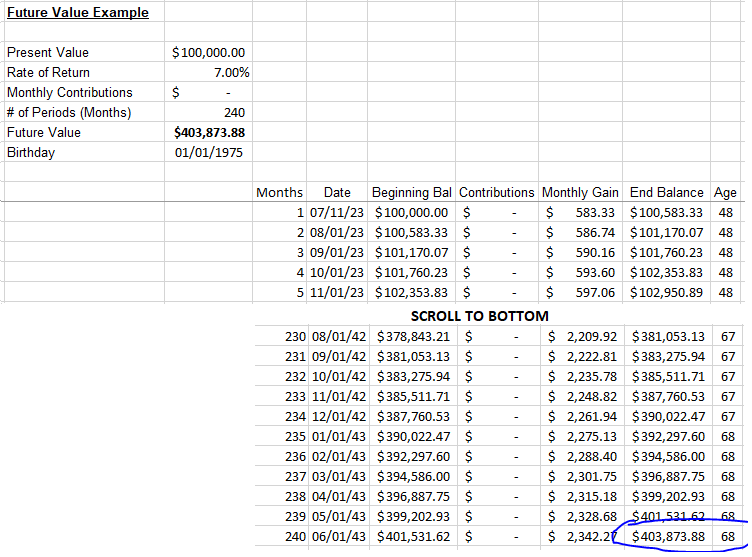
If I had $100,000 in a portfolio today that I expect to earn an average of 7% per year over the next 20 years, it would be worth $403,873.88 in 2043.
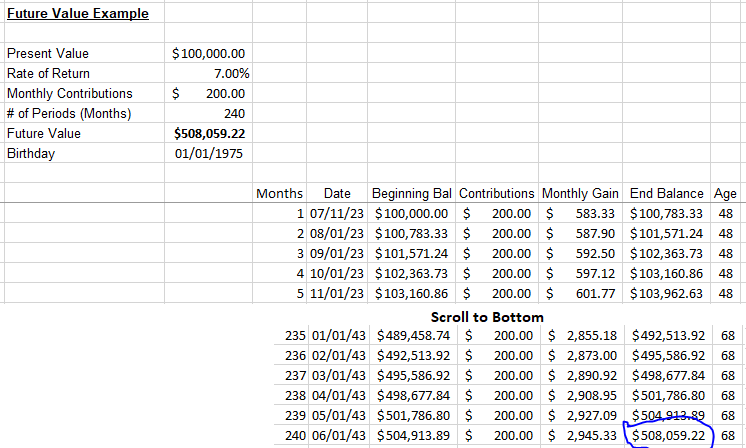
That’s if I invest that money and never touch it. If I also invested an additional $200 per month at 7% over that same period, the portfolio would be worth $508,059.22.
The Excel “FV” function works well, but I prefer manually building the calculation month-by-month with a future value table. The month-by-month method is more tangible, showing how the money grows every step of the way. I’ll share my spreadsheet below.
Table of Contents
Why is Future Value important?
The financial independence number is a rule of thumb to help determine your “enough” number.
Future value estimates when you’ll reach it.
It also provides a framework to tweak your savings plan to reach the number faster (e.g., if you invest another $300 per month, you’ll hit your goal 4 years sooner).
Not knowing our enough number is like driving in a tunnel with no light at the end. We risk locking ourselves in a career we don’t enjoy, ignoring the life we prefer to live.
If your only goal is more, you’ll never get there. — Joshua Becker
Future Value Spreadsheet
Note: The example in this article is included in the free companion future value spreadsheet. Download it now and experiment with your numbers.
Future Value Formula
Future value is the basic compound interest formula. Merriam-Webster defines compound interest as:
Interest computed on the sum of an original principal and accrued interest.
The future value formula works for specific assets, such as an individual investment (one stock) or broader assets like a retirement portfolio or net worth.
Here’s the formula:
FV = PV(1+r)^n

Future Value = Present Value (1+ rate of return) ^ Number of periods (months or years)
Future Value (FV)
Future value is the estimated value of an asset at a future date, given a timeframe and expected return or interest rate.
Present Value (PV)
Consider the PV as your net worth or retirement portfolio for this example.
The FV formula lets us calculate our net worth at a future date, given a set of variables and assumptions.
It starts with the present value and adds some magic – investment returns (r) and time (n).
Rate of Return (r)
The rate of return (r) is your average annual expected investment return.
For example, a U.S. stock index fund’s expected average annual return over 20 years is around 9%. But a more conservative 60/40 stocks/bonds portfolio may be about 6%.
Use your specific anticipated rate of return for your calculation, and be safe by underestimating. Consider adding an inflation adjustment (more below).
If you’re compounding the investment monthly, divide “r” by 12 and multiply the number of periods for “n” by 12.
Number of Periods (n), Time
How far out do you want to project your net worth or investment portfolio?
In our example, we’re using 20 years compounded monthly. That makes our n=240 (20 x 12).
Example Inputs
We’ll use the following inputs for our example:
- PV = $100,000
- r = 7% (annual return, or 0.5833% monthly)
- n = 240 (months)
Here’s the math equation solved:
FV = PV(1+r)^n
FV = 100,000(1+.0058333333)^240
FV = $403,873.88
In Excel, it looks like this using the built-in FV formula:
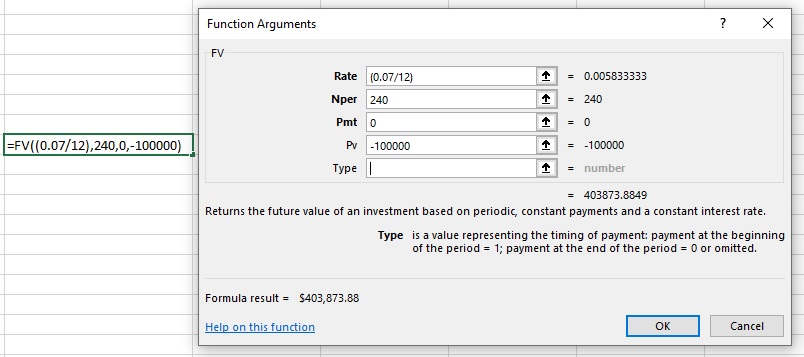
I take it a step further in my spreadsheet. It does the same calculation but one month at a time.
Using a future value table in Excel makes it easier to visualize and understand. It gets the same value as the formula.
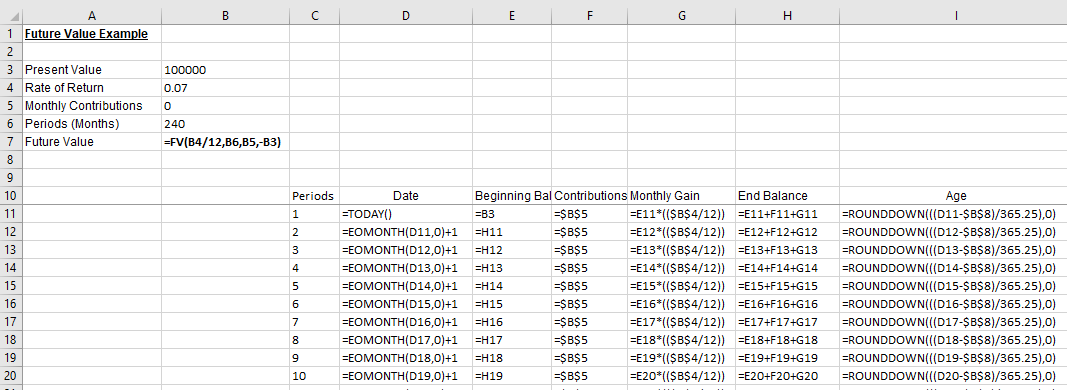
Here is the Excel formula view to see how I calculate each field.
Incorporating Payments (Portfolio Contributions)
The basic future value formula excludes contributions or payments (additions or withdrawals from your portfolio).
In our example, we’ll use the payment as a contribution to a portfolio, adding $200 every month. This value is abbreviated as PMT in finance and the Excel formula. I call it the Contributions column in my spreadsheet.
The math formula for this scenario is more complicated. Hat tip to Calculator Soup for help on the formula.
FV = PV(1+r)^n + ((PMT/r) * ((1+i)^n - 1))
The Excel formula and my spreadsheet are much easier to understand. I already added the fields to the example above. Now we only need to input our value of $200, which populates the table.
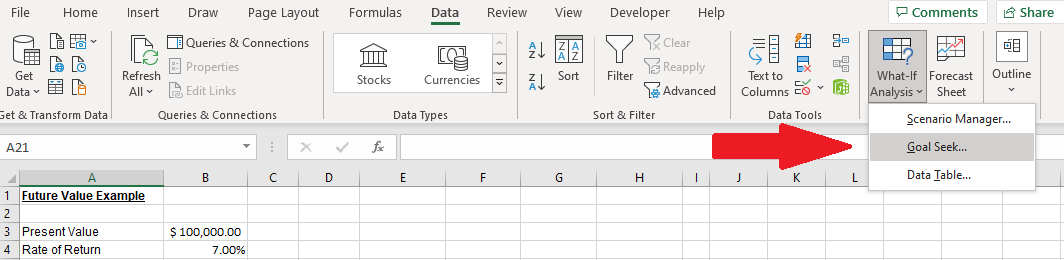
Using Goal Seek to Reach Savings Goals
If you want to reach a specific goal on a certain date, you can use the Excel Goal Seek functionality to figure out how much you need to invest each month to reach your goal.
For example, let’s say we want to save $450,000 by the date we turn 65. Given the previous assumptions, how much would we need to save each month to reach that goal?
To do this, scroll down to the goal date. Highlight the End Balance value, then navigate to Data / What-If Analysis /Goal Seek.
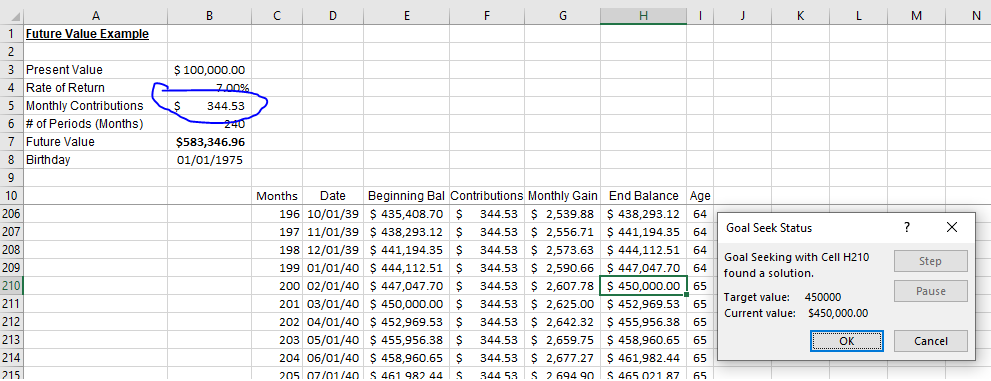
The “Set cell:” value will default to the cell highlighted. The “To value:” value should be the goal dollar amount. “By changing cell:” should point to the Monthly Contributions value field in the inputs section.
When you hit OK, the function finds the precise value to reach the goal.
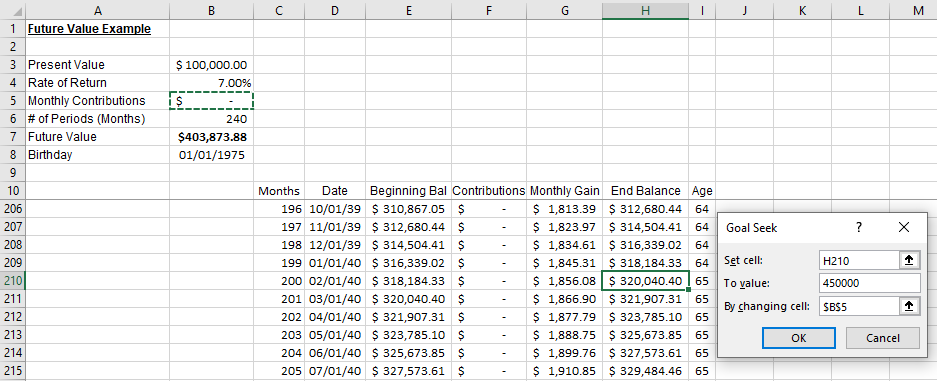
In this example, Goal Seek calculates that it would take a monthly contribution of $344.53 to hit the target amount by the target age/date.
I use this function all the time. Sometimes it tells me I should invest more to reach my goals.
Other times it tells me my goals are unrealistic.
Accounting for Inflation
Inflation impacts our savings by reducing the spending power of our nest egg.
We can account for inflation in a few ways using spreadsheet projections.
The easiest way is to modify the rate of return to be inflation adjusted. Estimate the rate of return and reduce it by the anticipated inflation rate. Inflation has been higher this past year than the past 20, but economists typically use 2-3% as the long-term inflation rate.
If you expect 7% returns, you can use 5% to account for inflation.
Another method is to add another column to the future value table that shows the value of $100,000 in today’s dollars versus the target date.
For example, in 2043, $100,000 will only be worth $67,122 in today’s dollar at a 2% long-term inflation rate. So you’ll need to save more money to achieve the same level of spending.
In 2043, $403,873.88 will only be worth $271,086.24 in today’s dollars.
These are all estimates, of course. But it’s helpful to build inflation into models to encourage ourselves to save extra money so we don’t end up short.
Meaningless and Important
The future value formula in the context of financial independence gave me the confidence to leave my career to become a full-time blogger.
Individual investors, especially younger ones, spend much time thinking with portfolio allocation, investment options, tax-advantaged investing, etc.
These activities are important.
But if the present value of a current portfolio is zero or insignificant, then “r” and “n” are meaningless.
I wrote about this recently at the HumbleDollar.
Early in my career, I spent my free time at work tinkering with spreadsheets, running financial models, and tweaking various scenarios. I thought modeling out the next 30 years of my financial life was being smart with my money.
But in hindsight, my time would have been better-spent networking, pursuing the next promotion, or building a side business to increase my assets because earning 7% vs. 9% doesn’t move the needle much when there are only a few thousand dollars to invest.
Higher returns matter when the nest egg is large. That only happens once many of us are older, and that’s when we need to reduce portfolio risk and accept lower returns.
The Magic of Compound Interest
Time is the most powerful factor when it comes to building wealth.
Look at the 20-year mark below. You can see how the growth is starting to kick in, even at a conservative 6% rate of return.
But when you get to the 30 and 40-year marks, the total interest separates from the total principal.
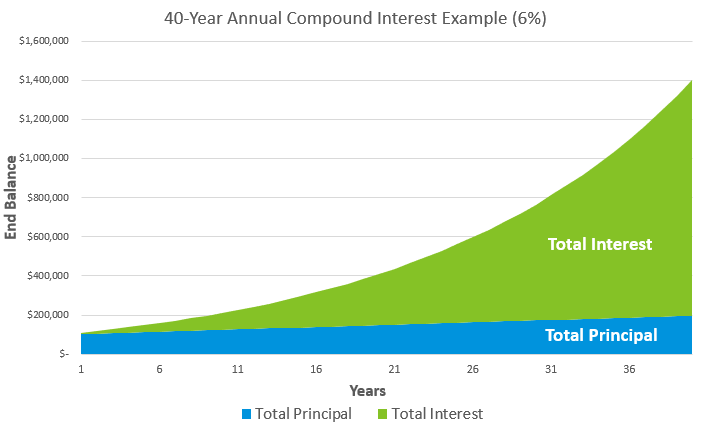 This is the magic of compound interest.
Unfortunately, it takes a long time and a lot of money to kick in. We can build spreadsheets to project how saving and investing will eventually lead to significant wealth over time.
But we can’t make time happen faster, and we can’t reverse time to save more in our youth.
The best way to move the wealth needle today is to increase the gap between what we earn and spend, freeing more money to invest — until there’s enough.
Magician photo via DepositPhotos used under license.

Craig is a former IT professional who left his 19-year career to be a full-time finance writer. A DIY investor since 1995, he started Retire Before Dad in 2013 as a creative outlet to share his investment portfolios. Craig studied Finance at Michigan State University and lives in Northern Virginia with his wife and three children. Read more.
Favorite tools and investment services (Sponsored):
Boldin — Spreadsheets are insufficient. Build financial confidence. (review)
ProjectionLab — Build financial plans you love. (review)
Empower — Free net worth and portfolio tracking + retirement planning. User since 2015.
Sure Dividend — Research dividend stocks with free downloads (review):
- Dividend Kings — 50+ stocks that have increased dividends for 50+ years.
- Monthly Dividend Stocks — List of 70+ stocks that pay a dividend every month.
- Dividend Champions — 140+ stocks that have increased dividends for 25+ years.