Can I Retire at 55? – Three Retirement Calculators Shed Light
 A retirement goal is meaningless without a plan to get there. As I get closer to my retirement age goal, I’m as interested in detailed projections as I am saving and investing strategies. All to ensure I can retire at 55.
Spreadsheets are fantastic tools to model financials and make pretty charts. I use custom spreadsheets to keep track of dividend income, annual spending, and to measure progress toward financial independence.
I share the charts on my Portfolio page.
But spreadsheets will only get you as far as you’re willing to custom-build a model.
Lately, I’ve been experimenting with online retirement calculators to get more sophisticated feedback about the feasibility of retiring at 55.
Retirement calculators all work mostly the same way but vary in how much input they take in and what they can tell you.
They start by compiling the assets you have today. Then, add in future savings and investment returns from today until full retirement date (for me, currently set for ~May 2031). Once all the data is factored in (including inflation), the calculators project how long your savings will last from your retirement date until death.
To formalize this exercise a bit more, I selected three different tools to analyze my retirement plan. I’ve used all three before, but I’ve only recently gotten serious about updating the details. It’s easier to do this now that I’ve consolidated accounts.
Table of Contents
The Three Calculators
The three calculators are:
- the Boldin Retirement Calculator (formerly NewRetirement),
- the Empower Retirement Planner
- and the Fidelity Planning and Guidance Calculator
Below you’ll see the output from all three. Each model contains complicated algorithms using hundreds of data points. These are simulations and by no means 100% accurate or reliable.
Note: These charts are for illustrative purposes. I’ve erased the chart scales to obscure the financial details. Your results will show more detail.
The results from all three were in the same ballpark. I’d be comfortable using any of them exclusively to update my plan regularly.
Let’s take a look at the results.
Assumptions
The calculators accept varying input data. I did my best to be consistent with input data across the calculators. Additional calculator assumptions and default values are described in the fine print.
The underlying assumptions and the college numbers for my kids are below. I was also consistent with the amount of monthly savings and investing, and investment returns I used among the three tools.
Basics
| RBD | Mrs. RBD | |
|---|---|---|
| Age at Retirement | 55 | 52 |
| Life Expectancy | 90 | 90 |
| Start taking Social Security | 67 | 67 |
| Social Security Benefit | $3,000 | $2,000 |
| Long-Term Investment Returns (Optimistic) | 7% | 7% |
| Long-Term Investment Returns (Pessimistic) | 3% | 3% |
Kids
I used a very rough estimate to get the annual cost for in-state tuition using this college savings calculator.
| College | Begin | End | Estimated Annual Cost |
|---|---|---|---|
| Son | 2030 | 2034 | $35,000 |
| Daughter | 2032 | 2036 | $37,000 |
| Daughter | 2034 | 2038 | $39,000 |
Other
The calculations do not include income from my side business (this blog). I’ve also assumed that Mrs. RBD will not go back to work. She might, but the income is not predictable at this time. I factored in $2,000 in monthly healthcare insurance costs after retirement.
Boldin
Boldin is my favorite calculator of the three because of how much you can customize the settings. However, the customization can be overwhelming. If you’re looking for a quick calculator, the next one might work better for you.
But if you’re serious about retirement planning, it’s worth spending 30-60 minutes to input and tweak your data. One downside is that Boldin doesn’t support connectivity with your bank and investment accounts yet, so you must manually input data and update it regularly.
Boldin recently released a refreshed dashboard view. Here’s a look at the main dashboard screen:
Boldin Score
On the top left is the NewRetirement score. The number represents the percent that my estimated assets would cover my lifetime expenses. A score of 100 would be just enough to cover lifetime expenses. The higher, the better. Lower than 100, either more savings or lower expenses are needed for a secure retirement.
After plugging in the numbers, my score stands at 127 in the Great range. Ranges are as follows:
-
-
- Needs Work: Projected income is < 65% of your projected need
- Fair: Projected income is 65% to 80% of the need
- Good: Projected income is 81% to 95% of the need
- Great: Projected income is > 95% of the need. Projected income should meet or exceed your expenses. The score can exceed 100.
-
The score changes when you tweak the input, so it’s essential to be as precise as possible. But the calculator allows for experimentation too.
The 127 score gives me the warms fuzzies at first, but ideally, I’d like to have the option to retire earlier than 55. I also ran the simulation using age 50. The results are toward the end with the other calculators.
Lifetime Retirement Projection
The most telling view on the dashboard is the Lifetime Retirement Projection chart. This dynamic chart updates when you make changes to inputs. It’s interactive, so you can click and highlight parts of it to get more details.
Here’s a closer look at the optimistic scenario.
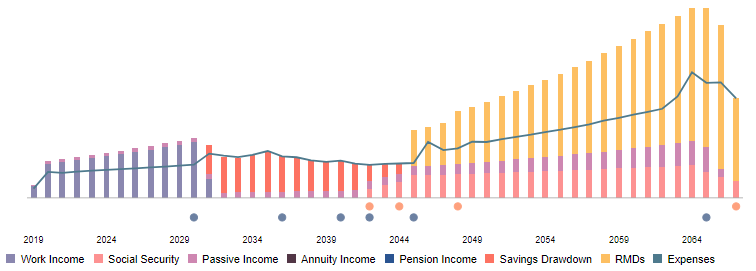
The legend at the bottom says what each bar and color represents. On the left, you can see my work income, which should continue to flow until my retirement date. The blue line represents spending. My spending is modeled to increase while my kids attend college and decrease after they’ve all graduated.
The purple color throughout the chart is passive income. Boldin’s tool is the best of the three for accounting for passive income.
Once I retire at 55, the model has me drawing down taxable investments first (shown in red/orange) until Social Security kicks in. When I turn 70 1/2, the required minimum distributions hit.
If you do this yourself, you’ll also see a scale on the left side and details when you hover over the bars. Projecting out so far can make for some big numbers, and small tweaks can have a significant impact on the chart and the overall score. The pessimistic scenario is far less rosy.
Other Sections
On the left, the Coach Suggests section helps to direct you where to make tweaks that will have the most significant impact. I found myself going back to make changes using the Coach’s suggestions.
The other two charts are self-explanatory. The My Plan section on the bottom left has links to make additional changes to the model. There’s also a Plan Inspector tool to model each data set and adds some cool visualizations, especially the Future Values view.
Boldin Bottom Line
Boldin does a great job of getting as many details from you as possible. It uses each data point to create the dashboard. You can create multiple scenarios to model various investment returns, expenses, growth rates, and life events that could change the numbers.
Overall, I like the tool a lot. The company is continuously improving the model to make it more user-friendly and dynamic. The visualizations have become quite helpful and sophisticated.
The one drawback is that all input is manual at this point. There are plans to eventually use API’s to bring in account data like other platforms.
You can create a personalized Boldin free for 14 days, which gives you all of the functionality I used for my analysis. There’s also an upgrade to PlannerPlus if you want enhanced budgeting capabilities and other upgrades.
Empower
The Empower Retirement Planner analyzes the data already connected from calculating your net worth and runs the simulations. Most of the work is already done for you, making it the most straightforward calculator to implement of the three.
I’ve used Empower for many years to track investments and net worth. The Retirement Planner tool seems to have some updated features I’ve just recently noticed. Namely, the college planning customization tool is very beneficial now.
The Empower score is different than the Boldin score. The score is a percentage likelihood that the portfolio will support my retirement goal.

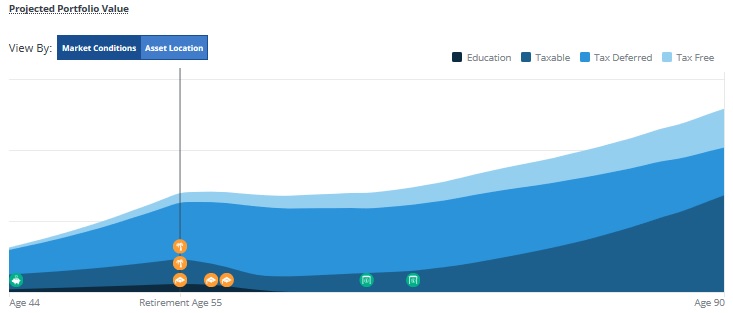
Empower provides two primary projection views. Projected Portfolio Value view estimates the median value of my portfolio (after expenses) until age 90 using statistical data from 5,000 simulations, broken out by account type.
The orange dots represent retirement dates and college freshman years. The two green dots in the middle are the years we start taking Social Security.
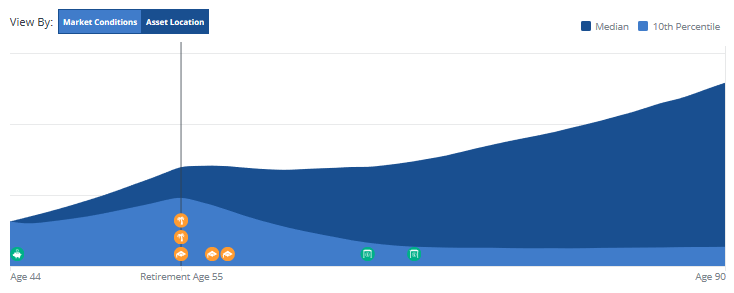
The second view is similar but doesn’t break it out by account type. Instead, it shows the median projection vs. the bottom 10th percentile projection. The lighter blue area is a less rosy future.
Empower Bottom Line
Empower is by far the easiest calculator to use because it already has your data if you’ve connected your accounts. The best feature is that most of the required information is automatically updated every time you log in. The retirement calculator reruns the simulation with the freshest data whenever you want.
New functionality allows you to input any income or spending data, most notably, real estate income or college expenses. These inputs help make the planning tool more accurate. Of course, like all calculators, you’ll need to check back every so often to track your progress.
You can sign up for Empower to track investments, calculate your net worth, and run the retirement planner (and fee analyzer) for free.
Fidelity Planning and Guidance
Most of my investment money is now with Fidelity. Consolidating accounts has made it easier to import my data into the Planning and Guidance calculator. The numbers update automatically for internal accounts but do not update for external accounts such as our 529’s.
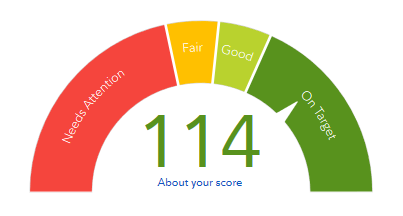
The Fidelity calculator has helpful goal-setting capabilities built-in that I used to model college expenses and our retirement date. It also lets me put in expected future contributions to my various accounts, helping to estimate growth and investment returns. The Fidelity score is similar to the Boldin score, represented as a percentage of expense coverage.
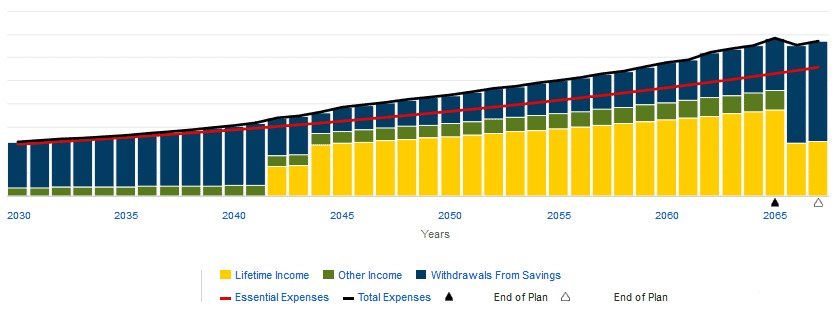
Here’s a detailed view of income and expenses similar to the Boldin view, but it starts after my retirement date. Passive income is the green line, while blue is withdrawals from savings. The red and blue lines are essential expenses and total expenses. Lifetime income is labeled yellow, but I did not input any annuity data. It may be RMDs. Not sure.
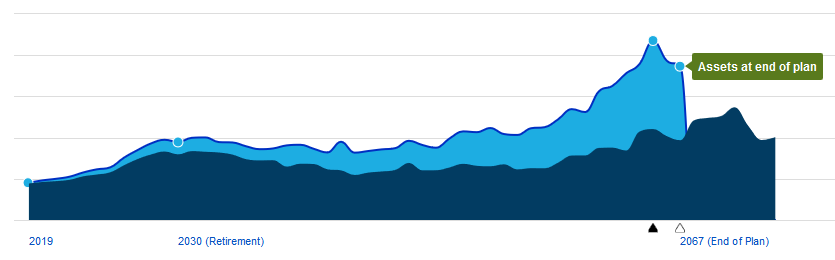
There’s another view that shows hypothetical asset growth which fluctuates from withdrawals and market growth. I believe the two colors are varying scenarios (below average vs. average). But the description isn’t great. What this tells me is I should have money left over at age 90, which is consistent with the other calculators.
 Fidelity Bottom Line
Overall, the Fidelity calculator is OK. But the visualizations could use improvements and better explanations. I also found that some of the data I put in didn’t save at first. I spent a lot of time tweaking the tool to get it right. The charts also changed a few times when I didn’t modify the inputs.
I like that my information is already in their system, but it still required a lot of estimations about future contributions and savings. College planning was straightforward, and it offered some estimates on future college costs.
Used exclusively without comparing it to the two previous tools, it’s perfectly suitable for estimating retirement feasibility. But I prefer the Boldin and Empower tools.
The Fidelity planning tool is only available for Fidelity customers.
Summary of Retire at 55 Scores
Here’s a review of the scores when I set the calculators to retire at 55:
-
-
- The Boldin score is 127
- Empower percentage is 92%
- The Fidelity score is 114
-
Retire at 50 Scores
Once I completed all of the simulations above, I updated my retirement age to age 50 on all three calculators to see how the probabilities would adjust. To my surprise, the numbers were encouraging.
-
-
- The Boldin score is 103
- Empower percentage is 70%
- The Fidelity score is 86
-
These promising numbers are a result of all the saving and investing I’ve done since I was broke and living with my parents. It goes to show that the earlier you begin, the better off you are over the long-term. That’s not to discourage people who didn’t start early. Set your own goals and work hard to reach your realistic retirement target date.
The main takeaway from changing my retirement date to age 50 is that if I can increase my earnings and lower expenses, retiring earlier is a realistic possibility. But a lot can happen in the next decade, so I won’t be exiting the workforce any time soon. Additional income from Mrs. RBD or my side business could also impact my ability to retire sooner or later.
Conclusion – Can I Retire at 55?
All three models indicate that I should reach my retirement goal safely at age 55. However, these are simulations, and by no means a guarantee. As I approach my retirement date, I’ll be updating and tweaking these calculators to get updated feedback.
Market fluctuations can dramatically alter outcomes.
From now on, I’ll be working to increase the likelihood that I can safely retire at 55. And ideally, I’d like to have the option to bump up my potential retirement date, even knowing the realities of healthcare and college costs. For age 50 to be a possibility, I’ll have to accelerate passive income cash flow and in increase side income.
Featured photo via DepositPhotos used under license.

Craig is a former IT professional who left his 19-year career to be a full-time finance writer. A DIY investor since 1995, he started Retire Before Dad in 2013 as a creative outlet to share his investment portfolios. Craig studied Finance at Michigan State University and lives in Northern Virginia with his wife and three children. Read more.
Favorite tools and investment services (Sponsored):
Boldin — Spreadsheets are insufficient. Build financial confidence. (review)
ProjectionLab — Build financial plans you love. (review)
Empower — Free net worth and portfolio tracking + retirement planning. User since 2015.
Sure Dividend — Research dividend stocks with free downloads (review):
- Dividend Kings — 50+ stocks that have increased dividends for 50+ years.
- Monthly Dividend Stocks — List of 70+ stocks that pay a dividend every month.
- Dividend Champions — 140+ stocks that have increased dividends for 25+ years.