My Retirement Asset Allocations and Improved Portfolio Page

To be more transparent about my overall investment strategy, I’ve redesigned my Portfolio page and will be explaining the changes in today’s blog post. It now includes the details of our retirement asset allocations, my dividend growth stock portfolio, the forward 12-month investment income (F12MII) chart, and a new financial independence progress chart.
I did not write an investment income update for Q1. After more than five years of writing them, I finally decided to stop because they were repetitive, and they didn’t give readers enough of the big picture.
Since the beginning of this blog, I’ve primarily written about my taxable dividend stock portfolio and other taxable income streams. But this was always a narrow focus. In the background, I was continually investing in employer-sponsored accounts and IRAs.
Those investments were sort of scattered and disorganized for years because I neglected to consolidate accounts or annually rebalance. But with the recent transfer from Vanguard to Fidelity and subsequent rebalancing of funds, it’s now easier for me to measure and share the asset allocations in our retirement accounts.
Going forward, I will regularly update and improve the Portfolio page, but I will not be continuing the quarterly updates. The new Portfolio page is designed to provide a visual depiction of our investment allocations and make monthly updates easier.
The Portfolio page is in the top menu for easy access.
Retirement Asset Allocations in Our Tax-Advantaged Accounts
Mrs. RBD and I have six different retirement accounts. All are now with Fidelity.
They include two traditional IRAs, two Roth IRAs, and two employer-sponsored retirement accounts (a 403(b) and 401(a) with my current employer).
Since I started my first real job in 1998, I’ve mostly invested in mutual funds in my retirement accounts. For most of those years, the investments were in managed mutual funds (with high fees) because that’s all that was available in my old employer plans.
It wasn’t until I left my long-time employer in 2017 that I could transfer my 401(k) money into a traditional IRA and low-cost index funds. I also own a few individual stocks and have some cash sitting idle at the moment.
Mrs. RBD’s retirement accounts have been in index ETFs since she stopped working. But I’ve recently converted those to index funds to match the index funds in my accounts. Utilizing the same index funds makes portfolio analysis and rebalancing more straightforward.
Now that the Vanguard to Fidelity transfer is complete, I can take a more comprehensive look at our combined retirement asset allocations by exporting the data and creating pivot tables and charts in Excel. I’ve cut and pasted those charts into this post and the new Portfolio page.
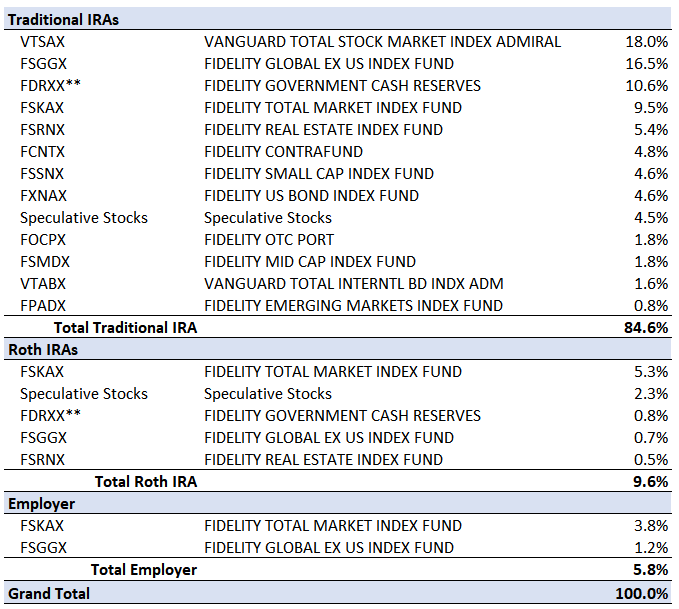
Here’s an aggregated look at the retirement asset allocations of our six retirement accounts (mobile users, scroll right).
| Symbol | Description | % |
|---|---|---|
| FSKAX | FIDELITY TOTAL MARKET INDEX FUND | 24.33% |
| FSGGX | FIDELITY GLOBAL EX US INDEX FUND | 16.65% |
| FDRXX** | FIDELITY GOVERNMENT CASH RESERVES | 12.58% |
| Specs | Speculative Growth Stocks | 12.42% |
| FXNAX | FIDELITY US BOND INDEX FUND | 6.84% |
| VTSAX | VANGUARD TOTAL STOCK MARKET INDEX ADMIRAL | 6.26% |
| FCNTX | FIDELITY CONTRAFUND | 5.03% |
| FSSNX | FIDELITY SMALL CAP INDEX FUND | 4.47% |
| FSRNX | FIDELITY REAL ESTATE INDEX FUND | 3.48% |
| FSMDX | FIDELITY MID CAP INDEX FUND | 2.55% |
| FOCPX | FIDELITY OTC PORT | 1.98% |
| FPADX | FIDELITY EMERGING MARKETS INDEX FUND | 1.50% |
| VTABX | VANGUARD TOTAL INTERNTL BD INDX ADM | 1.37% |
| SPAXX** | FIDELITY GOVERNMENT MONEY MARKET | 0.53% |
| GRAND TOTAL | 100.00% |
Here’s the same list of assets broken out by retirement account type.
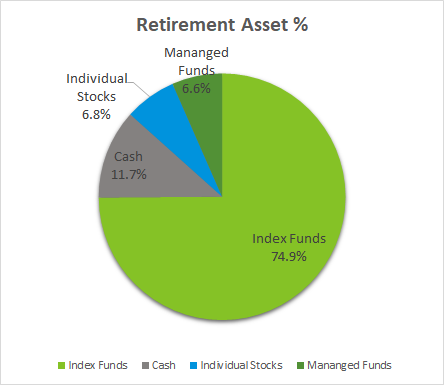
Here’s the breakdown of ind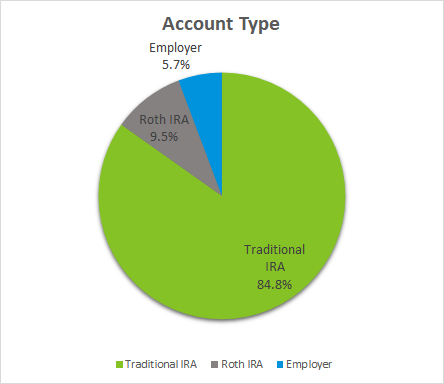 Here’s the breakdown of index funds vs. managed funds, cash, and speculative growth stocks in our six retirement accounts:
And another chart further breaking down the fund types:
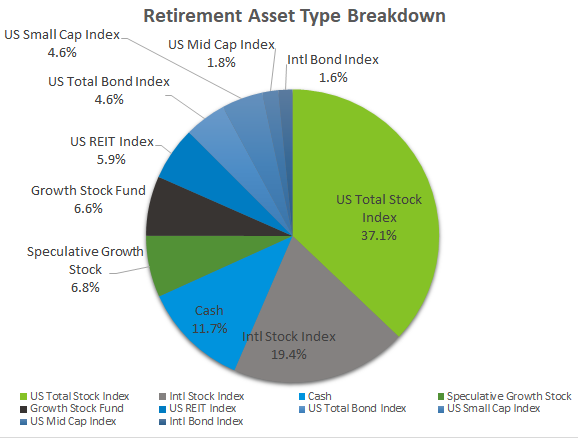
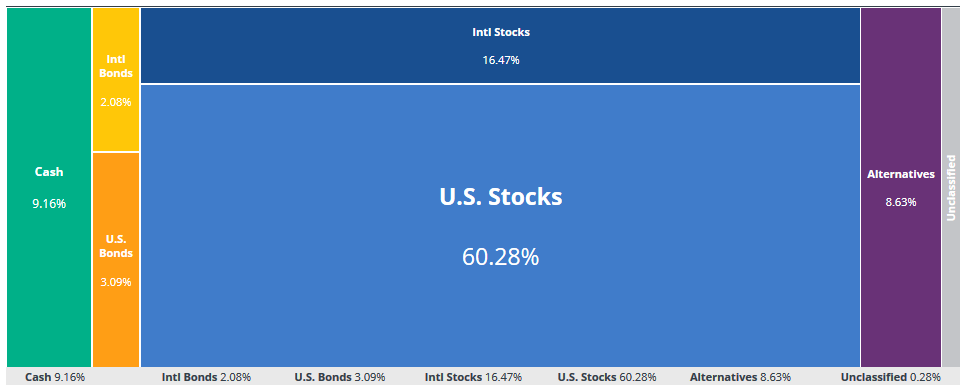
I prefer to make these charts in Excel. But I do also keep track of my asset allocations in Empower. The software categorizes certain assets differently, which is why the numbers don’t line up exactly. It considers the REIT index funds as alternatives.
A few notes on the above charts and tables:
At 15%, the cash allocation is much higher than I want it to be. This is due, in part, to the consolidation of accounts. However, the market has gone straight up during the first half of 2019. I’d rather wait for a pullback before putting the money to work.
I’m now investing aggressively in my employer-sponsored accounts and receiving a 10% match, so I expect to see that slice of the pie become a more substantial proportion in the next few years.
VTSAX (Vanguard Total Stock Market Fund) remains a considerable portion of my traditional IRA because that’s where the money was before I transferred it. I’ll likely convert it all to FSKAX (Fidelity Total Stock Market Fund), but I’m hesitating in case I find a reason not to. Once I transfer out of VTSAX, I can’t get back in without paying a $75 fee to Fidelity.
I make small speculative stocks purchases in my retirement accounts to attempt to create gains that outpace the overall market. These holdings are not dividend growth stocks.
The plan is to keep my speculative stock picks to less than 10% of my overall retirement accounts.
Taxable Dividend Stock Portfolio
My dividend stock portfolio is the primary account that I’ve blogged about since the inception of RBD. Though I’m no longer reporting all of the specific transactions every quarter, I’m continuing to share my holdings and the income generated from the dividends.
The stocks in my dividend stock portfolio are not included in the tables and pie charts above.
The portfolio was held in an individual taxable account at TD Ameritrade for about 15 years. But I’ve recently transferred the entire account to a new taxable individual account with Fidelity. I’ll convert that to a joint account for estate planning purposes in the next few weeks.
I also own ten dividend growth stocks in a taxable account at M1 Finance. I’m investing $500 per month and reinvesting all the dividends back into the “pies”.
M1 Finance stocks are now marked with an asterisk (*) in the updated tables. Read my M1 Finance review to learn about dollar cost averaging with “pie” investing.
Here’s my taxable dividend growth stock portfolio as of May 1st. It currently pays me about $7,000 per year in forward 12-month income (mobile users, scroll right):
| Ticker | # of Shares | Annual Dividend | Annual Income | Yield | YOC% | Sector |
|---|---|---|---|---|---|---|
| AAPL | 112.00 | 3.28 | $ 367.36 | 0.90% | 4.88% | Technology |
| ABBV | 100.00 | 4.72 | $ 472.00 | 4.81% | 16.23% | Healthcare |
| ABT | 100.00 | 1.44 | $ 144.00 | 1.57% | 5.51% | Healthcare |
| ACN | 29.02 | 3.20 | $ 92.85 | 1.49% | 3.36% | Technology |
| ADM | 80.00 | 1.44 | $ 115.20 | 3.61% | 4.17% | Industrial |
| AFL * | 32.03 | 1.12 | $ 35.87 | 3.11% | 2.60% | Financial |
| APD * | 5.33 | 5.36 | $ 28.55 | 2.22% | 2.41% | Industrial |
| BAC | 419.00 | 0.72 | $ 301.68 | 3.03% | 4.61% | Financial |
| BEN | 130.00 | 1.08 | $ 140.40 | 5.15% | 3.82% | Financial |
| BRK-B | 15.00 | 0.00% | 0.00% | Financial | ||
| CAH * | 63.32 | 1.94 | $ 123.06 | 3.72% | 3.17% | Healthcare |
| CL | 24.00 | 1.76 | $ 42.24 | 2.40% | 2.80% | Consumer |
| CLX | 30.00 | 4.44 | $ 133.20 | 2.02% | 5.00% | Consumer |
| CMI * | 7.39 | 5.24 | $ 38.74 | 3.03% | 3.33% | Industrial |
| COST | 12.75 | 2.80 | $ 35.70 | 0.92% | 1.47% | Consumer |
| CSX | 100.00 | 1.04 | $ 104.00 | 1.49% | 3.66% | Services |
| CVX | 98.00 | 5.16 | $ 505.68 | 5.78% | 6.75% | Energy |
| DCI | 75.00 | 0.84 | $ 63.00 | 1.83% | 2.28% | Industrial |
| DIS | 60.00 | 0.00 | $ - | 0.00% | 0.00% | Consumer |
| DOV | 55.00 | 1.96 | $ 107.80 | 2.03% | 3.73% | Industrial |
| EMR | 108.00 | 2.00 | $ 216.00 | 3.22% | 4.09% | Industrial |
| FLO | 70.00 | 0.80 | $ 56.00 | 3.60% | 5.35% | Consumer |
| GD * | 26.19 | 4.40 | $ 115.26 | 2.94% | 3.57% | Industrial |
| GIS | 100.00 | 1.96 | $ 196.00 | 3.18% | 4.04% | Consumer |
| GS | 20.00 | 5.00 | $ 100.00 | 2.53% | 2.96% | Financial |
| HAS | 45.00 | 2.72 | $ 122.40 | 3.63% | 4.46% | Consumer |
| IBM | 30.00 | 6.52 | $ 195.60 | 5.40% | 4.91% | Technology |
| ITW * | 21.85 | 4.28 | $ 93.53 | 2.45% | 3.13% | Industrial |
| JNJ | 40.83 | 4.04 | $ 164.96 | 2.91% | 3.90% | Healthcare |
| KO | 254.00 | 1.64 | $ 416.56 | 3.67% | 5.62% | Consumer |
| LEG * | 41.24 | 1.60 | $ 65.98 | 4.55% | 4.50% | Industrial |
| LOW | 45.00 | 2.20 | $ 99.00 | 1.63% | 2.85% | Consumer |
| LUV * | 42.84 | 0.00 | $ - | 0.00% | 0.00% | Consumer |
| MA * | 4.16 | 1.60 | $ 6.66 | 0.54% | 0.57% | Financial |
| MKC * | 7.33 | 2.48 | $ 18.17 | 1.38% | 1.57% | Consumer |
| MMM | 35.00 | 5.88 | $ 205.80 | 3.77% | 4.23% | Industrial |
| MO * | 155.91 | 3.36 | $ 523.87 | 8.56% | 7.76% | Consumer |
| MSFT | 26.11 | 2.04 | $ 53.26 | 1.00% | 3.13% | Technology |
| NKE | 43.82 | 0.98 | $ 42.94 | 1.00% | 1.52% | Consumer |
| O | 90.00 | 2.80 | $ 252.00 | 4.71% | 6.29% | Real Estate |
| OZK | 300.00 | 1.08 | $ 324.00 | 4.79% | 4.35% | Financial |
| PEAK | 80.00 | 1.48 | $ 118.40 | 5.37% | 4.68% | Real Estate |
| PG | 39.00 | 3.16 | $ 123.24 | 2.65% | 3.90% | Consumer |
| PH | 45.00 | 3.52 | $ 158.40 | 1.92% | 3.24% | Industrial |
| PM | 60.00 | 4.68 | $ 280.80 | 6.68% | 5.85% | Consumer |
| PPG * | 12.38 | 2.04 | $ 25.25 | 1.92% | 1.94% | Industrial |
| ROST * | 13.87 | - | $ - | 0.00% | 0.00% | Consumer |
| RTX | 35.00 | 1.90 | $ 66.50 | 3.08% | 3.75% | Industrial |
| SBUX * | 16.61 | 1.64 | $ 27.23 | 2.23% | 2.40% | Telecom |
| T | 190.00 | 2.08 | $ 395.20 | 6.88% | 6.49% | Consumer |
| TGT | 80.00 | 2.72 | $ 217.60 | 2.27% | 4.62% | Consumer |
| THO | 40.00 | 1.60 | $ 64.00 | 1.50% | 2.84% | Financial |
| TROW | 60.00 | 3.60 | $ 216.00 | 2.91% | 4.54% | Services |
| UNP | 15.00 | 3.88 | $ 58.20 | 2.29% | 5.15% | Industrial |
| V * | 6.48 | 1.20 | $ 7.78 | 0.62% | 0.78% | Financial |
| VFC | 28.00 | 1.92 | $ 53.76 | 3.15% | 3.09% | Consumer |
| VTEB | 50.00 | 1.19 | $ 59.50 | 2.24% | 2.24% | EFT |
| VZ | 194.00 | 2.46 | $ 477.24 | 4.46% | 6.64% | Telecom |
| WBA | 110.00 | 1.83 | $ 201.30 | 4.32% | 3.08% | Healthcare |
| WTRG | 109.00 | 0.94 | $ 102.46 | 2.25% | 3.58% | Utilities |
| Total Dividends | $ 8,772.19 | 2.86% | * M1 Finance holding |
Forward 12-Month Investment Income (F12MII)
Here’s a newly formatted table for calculating the forward income I expect to earn in the coming 12 months. These numbers were previously reported in the quarterly reports but are now on the Portfolio page.
| Other Forward Income Streams | Yearly Income | Average Monthly Income |
|---|---|---|
| Dividends | 13032.32 | 1086.03 |
| Cash Savings + I Bonds | 3957.67 | 329.81 |
| RE Crowdfunding | 1775.22 | 147.94 |
| Total Forward Annual Income | 18765.21 | 1563.77 |
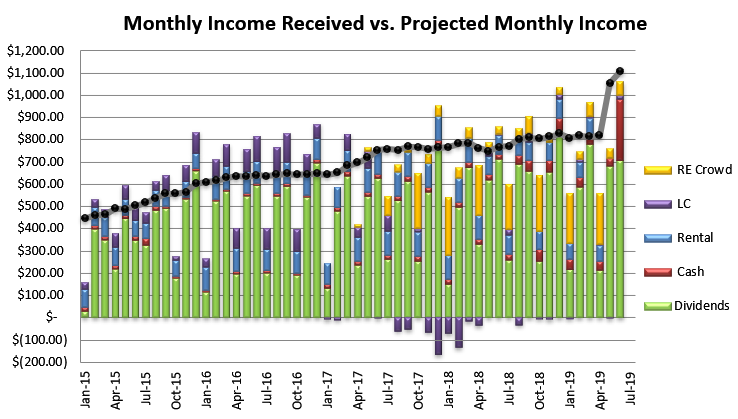
And here’s the familiar income received vs. project chart I’ve been updating since January 2015:
Total Combined Asset Allocation
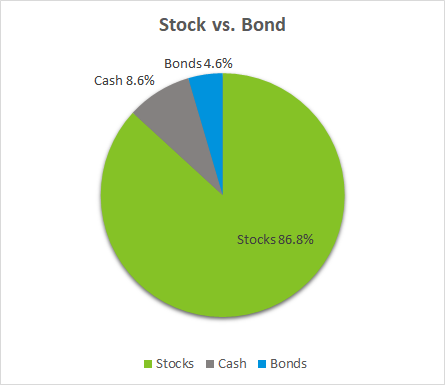
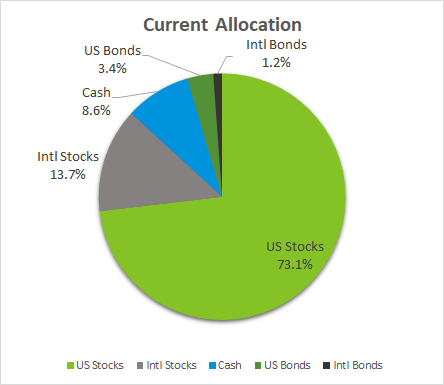
The next section shows my combined stock and bond portfolios in both retirement and taxable accounts. I’ll use these charts to better understand my portfolio for annual rebalancing.
My target allocation is closer to 75%-80% stocks, 10%-15% bonds, 5% (or less) cash. So I have some work to do. But I don’t want to change everything all at once because I’m still deciding how to allocate some of the cash.
These charts are helping me to understand where I should balance out my holdings. I haven’t included the assets in real estate crowdfunding platforms, but the quilt below does include them.
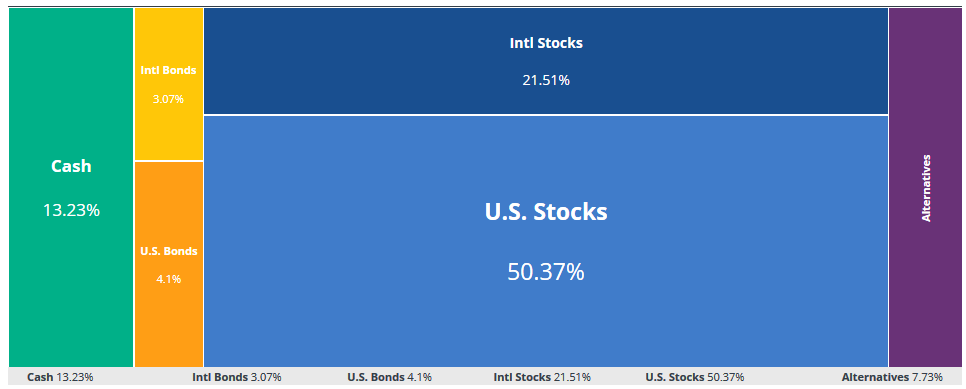
Here’s a shot of my current Empower allocation quilt for all accounts combined. This view includes alternatives and college savings, so the proportions are off from the above pies. I need to play around more to make the numbers match. It considers investments such as traded REITs as alternatives.
Progress Toward Financial Independence
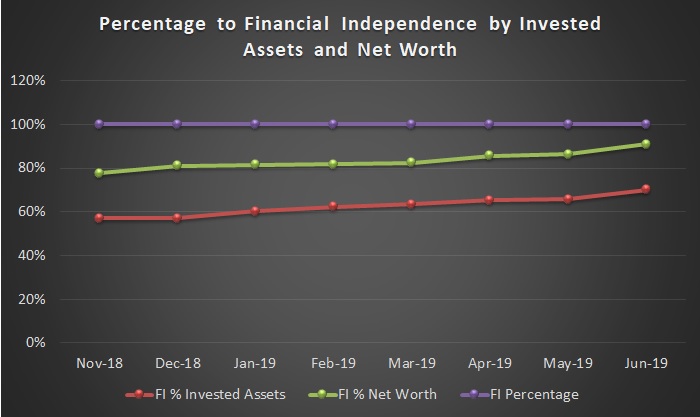
Earlier this year, I outlined exactly how I measure progress toward financial independence. Now that I’ve been collecting data for the past few months, I can assemble and share a new chart.
I start by tracking our annual expenditures and subtracting F12MII.
I multiply that number by 25 to give me a target financial independence number. Once our invested assets (which excludes the equity in our primary residence and college 529 savings) surpass our financial independence number, we’ve reached financial independence.
I also calculate our FI number against net worth, just for fun. I use Empower to calculate net worth.
Based on the latest numbers, we are 69% (June 2019) of the way toward reaching financial independence. Once the red line overtakes the purple line, we’ve made it.
Conclusion
Putting this information together is still a work in progress. I’m still formulating exactly what I need for my purposes and determining what is best to share with you, mostly in percentages instead of actual values.
It feels good to make my retirement accounts a more prominent feature on the blog because they have grown quite a bit since I started writing. The retirement money is what will eventually carry me into retirement, more than my after-tax income streams.
Neglecting to consolidate accounts and perform the analysis on my holdings held me back from creating a sufficient target portfolio allocation and rebalancing every year. Combining accounts and consolidating investment funds was a huge step toward better understanding our asset allocation.
The next steps are to continue earning, saving, and investing aggressively. I’ll also be refining these measures to make sure I’m on track for realizing my retirement goals.
How do you keep track of your retirement asset allocations? Fidelity also provides some charts that I considered adding above, but I’d rather make my own, at least for now. I may look to improve the web-friendliness of these in future with a WordPress plugin. Come back to the Portfolio page in a few months to see what changes.
Photo via DepositPhotos used under license

Craig is a former IT professional who left his 19-year career to be a full-time finance writer. A DIY investor since 1995, he started Retire Before Dad in 2013 as a creative outlet to share his investment portfolios. Craig studied Finance at Michigan State University and lives in Northern Virginia with his wife and three children. Read more.
Favorite tools and investment services (Sponsored):
Boldin — Spreadsheets are insufficient. Build financial confidence. (review)
ProjectionLab — Build financial plans you love. (review)
Empower — Free net worth and portfolio tracking + retirement planning. User since 2015.
Sure Dividend — Research dividend stocks with free downloads (review):
- Dividend Kings — 50+ stocks that have increased dividends for 50+ years.
- Monthly Dividend Stocks — List of 70+ stocks that pay a dividend every month.
- Dividend Champions — 140+ stocks that have increased dividends for 25+ years.